File:Example2.jpg
Jump to navigation
Jump to search
Size of this preview: 800 × 583 pixels. Other resolution: 909 × 662 pixels.
Original file (909 × 662 pixels, file size: 70 KB, MIME type: image/jpeg)
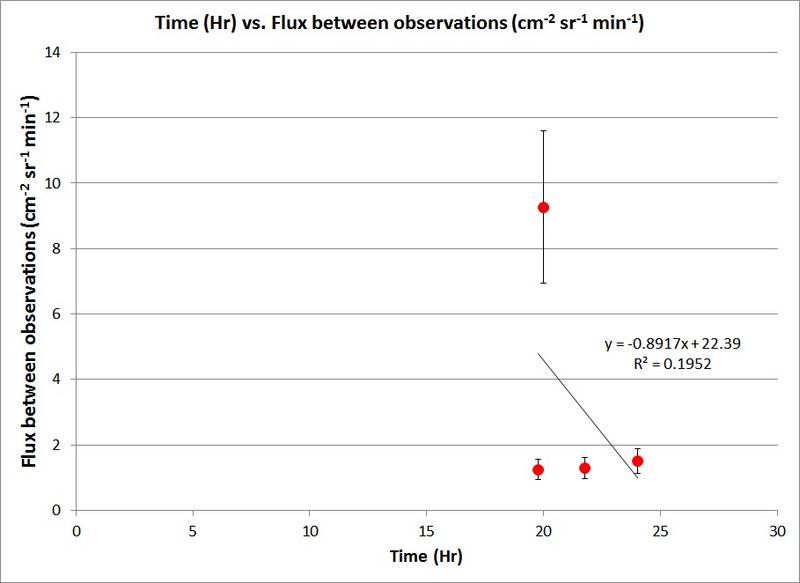
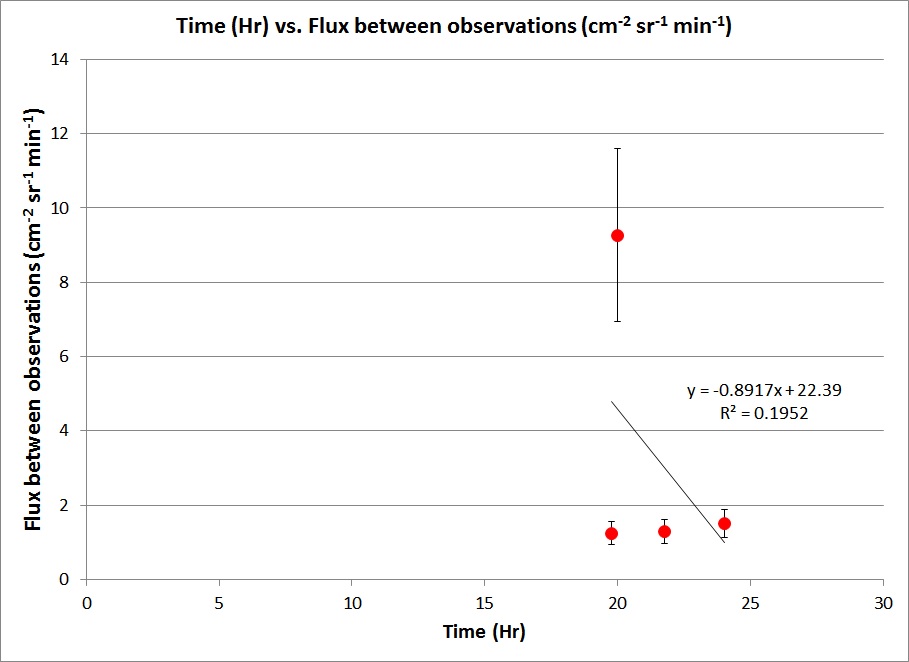
Fig. 2: The flux in between observations (from one time to the next) is displayed on the y. This shows that there was a large increase in between 19.75 and 20 hours in muon count. This data should fluctuate, but not by this extent. This shows that there was obviously some sort of jump in the count caused by the environment.
File history
Click on a date/time to view the file as it appeared at that time.
| Date/Time | Thumbnail | Dimensions | User | Comment | |
|---|---|---|---|---|---|
| current | 16:07, 10 July 2013 | | 909 × 662 (70 KB) | Derek.j.boylan (talk | contribs) | Fig. 2: The flux in between observations (from one time to the next) is displayed on the y. This shows that there was a large increase in between 19.75 and 20 hours in muon count. This data should fluctuate, but not by this extent. This shows that there w |
You cannot overwrite this file.
File usage
There are no pages that use this file.