File:Example3.jpg
Jump to navigation
Jump to search
Size of this preview: 800 × 583 pixels. Other resolution: 909 × 662 pixels.
Original file (909 × 662 pixels, file size: 69 KB, MIME type: image/jpeg)
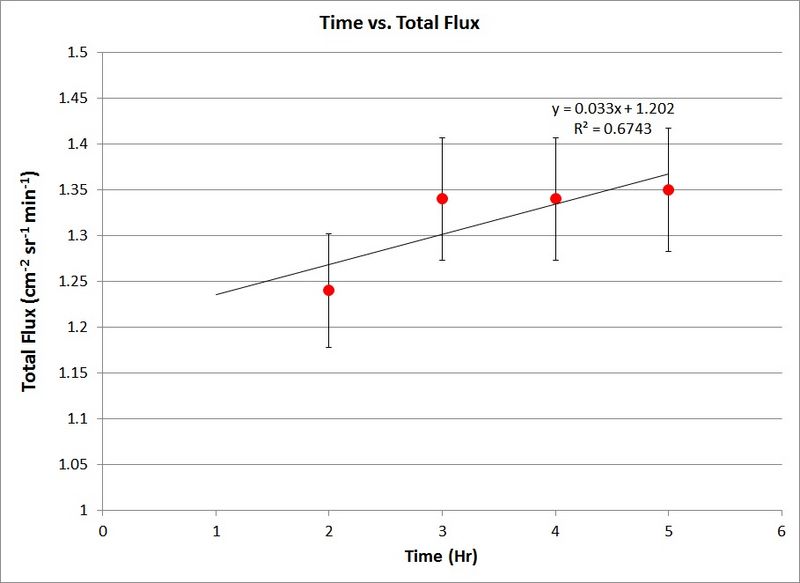
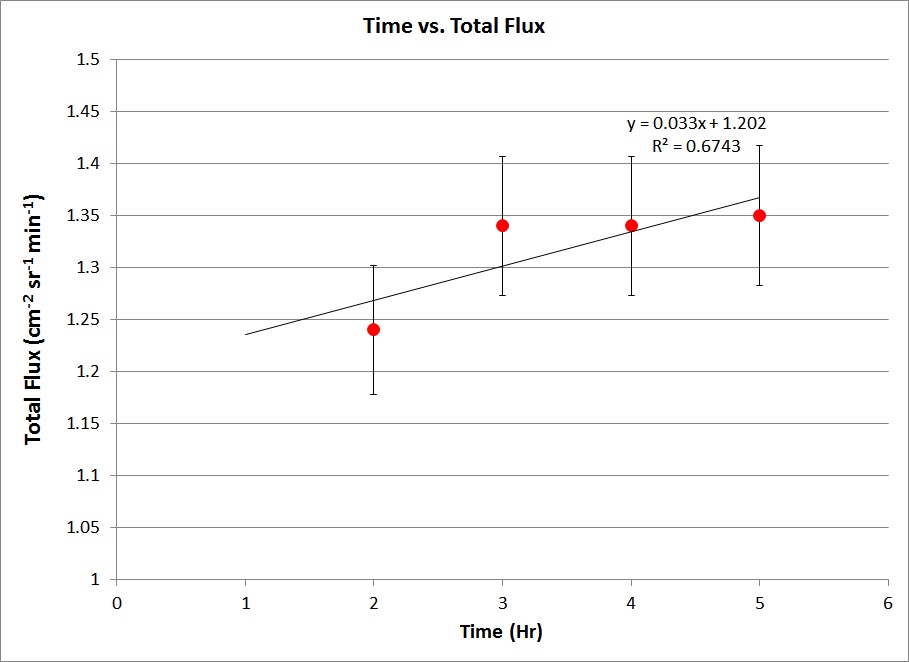
Fig. 3: The total flux at each time period is displayed on the y axis. Once the flux was very high in between 19.75 and 20 hours though, it increased the total flux substantially.
File history
Click on a date/time to view the file as it appeared at that time.
| Date/Time | Thumbnail | Dimensions | User | Comment | |
|---|---|---|---|---|---|
| current | 16:13, 10 July 2013 | | 909 × 662 (69 KB) | Derek.j.boylan (talk | contribs) | Fig. 3: The total flux at each time period is displayed on the y axis. Once the flux was very high in between 19.75 and 20 hours though, it increased the total flux substantially. |
You cannot overwrite this file.
File usage
There are no pages that use this file.