File:High-s2.png
Jump to navigation
Jump to search

Size of this preview: 708 × 600 pixels. Other resolution: 930 × 788 pixels.
Original file (930 × 788 pixels, file size: 104 KB, MIME type: image/png)
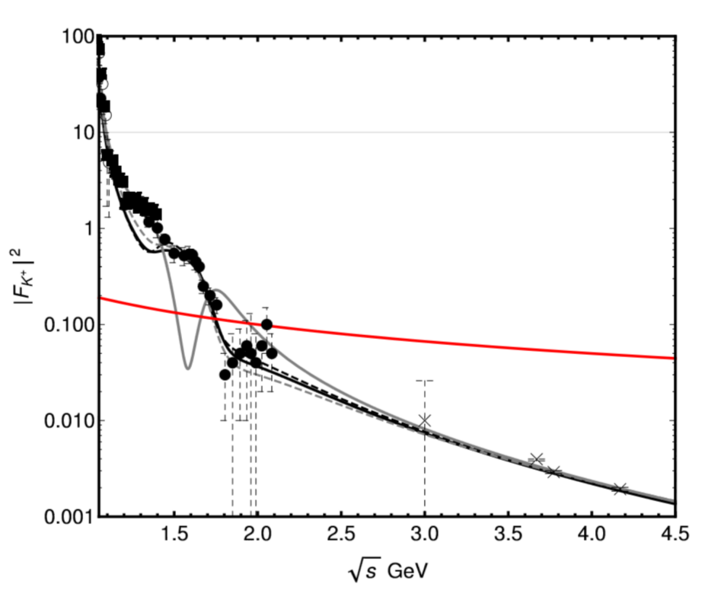
Plot of high-s data with curves obtained from fitting parameters.
K.S. Fit 1: Thick, black. K.S. Fit 2: Thick, gray. G.S. Fit 1: Dashed, black. G.S. Fit 2: Dashed, gray.
Note: Upon selecting "Evaluate Notebook," the graph differed from that shown evaluating K.S. and G.S. definitions distinctly.
File history
Click on a date/time to view the file as it appeared at that time.
| Date/Time | Thumbnail | Dimensions | User | Comment | |
|---|---|---|---|---|---|
| current | 14:30, 30 August 2016 | | 930 × 788 (104 KB) | Johann (talk | contribs) | Plot of high-s data with curves obtained from fitting parameters. K.S. Fit 1: Thick, black. K.S. Fit 2: Thick, gray. G.S. Fit 1: Dashed, black. G.S. Fit 2: Dashed, gray. Note: Upon selecting "Evaluate Notebook," the graph differed from that shown evalua |
You cannot overwrite this file.
File usage
There are no pages that use this file.