Difference between revisions of "MainPage:Nuclear:Summer2012:QuantumEfficiency"
(Created page with "{|border="1" cellpadding="2" cellspacing="0" style="background-color:lightgray" | <font size="2">'''⇐ Back to Summer 2012 page'''</font> |}") |
|||
| (14 intermediate revisions by 2 users not shown) | |||
| Line 1: | Line 1: | ||
{|border="1" cellpadding="2" cellspacing="0" style="background-color:lightgray" | {|border="1" cellpadding="2" cellspacing="0" style="background-color:lightgray" | ||
| <font size="2">'''[[MainPage:Nuclear:Summer2012|⇐ Back to Summer 2012 page]]'''</font> | | <font size="2">'''[[MainPage:Nuclear:Summer2012|⇐ Back to Summer 2012 page]]'''</font> | ||
| + | |- | ||
| + | | <font size="2">'''[[MainPage:Nuclear|⇐ Back to the Main_Page]]'''</font> | ||
|} | |} | ||
| + | |||
| + | == Quantum Efficiency == | ||
| + | Every PMT has a so-called "quantum efficiency" associated with it. These is the efficiency of the PMT photocathode window converting photons into electrons quantum mechanically via the photoelectric effect. | ||
| + | |||
| + | Typically these percentages hover around ~20%. In any case, it is an important property to know about the PMTs that will be used for the Kaon Aerogel Cherenkov Detector. | ||
| + | |||
| + | == JLab-Yerevan Results == | ||
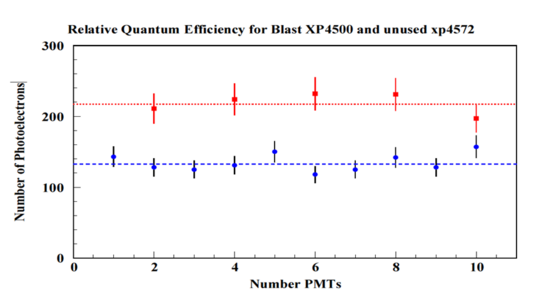
| + | Tests have been conducted at JLab by our collaborators in the Yerevan group that characterize the quantum efficiency of our PMTs. The PMTs that we plan to use were used in the BLAST experiment at MIT/Bates. The test was a relative quantum efficiency test and it compared the BLAST PMTs to spare HMS PMTs that had not been used. T | ||
| + | |||
| + | he results were quite interesting. Hopefully, you may view their plot below. Figure credit goes to Dr. Hamlet Mkrtchyan and the Yerevan Group. I took the figure from their eLog. | ||
| + | |||
| + | {| border="0" style="text-align:center;" width="100%" | ||
| + | |- | ||
| + | | style="width: 100%;" | [[File:quantumeff.png|x300px|Yerevan Plot]] | ||
| + | |} | ||
| + | |||
| + | == CUA Cross-check == | ||
| + | Hamlet invited others to redo the tests and investigate this puzzle, and indeed it is important for the performance of our detector to understand the quantum efficiencies of our PMTs. | ||
| + | |||
| + | The first step is to run some tests to compare the JLab and CUA setups. Simple Gain tests with an LED suffice for this. These tests are documented in the CODA Logbook on this wiki | ||
| + | |||
| + | [[MainPage:Nuclear:KaonDetector:PMTCharacteristics:LogBook:pag01|Coda logbook page 1]] | ||
| + | |||
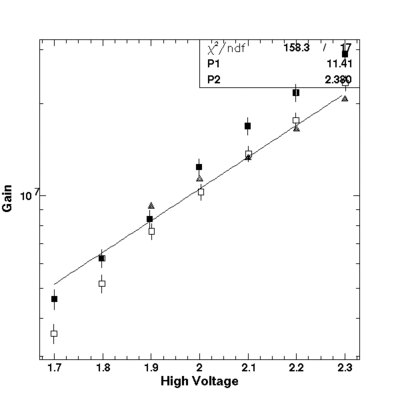
| + | And here is a figure of the three setups Gain measurements for one PMT (#9561). The triangles are JLab, the dark squares are Dark Box 1 (wood) and then light squares are Dark Box 2 (plastic) | ||
| + | |||
| + | {| border="0" style="text-align:center;" width="100%" | ||
| + | |- | ||
| + | | style="width: 100%;" | [[File:GainAll.gif|x400px|Gain Plot]] | ||
| + | |} | ||
| + | |||
| + | == Procedure == | ||
| + | The procedure for these tests will be much like Hamlet's. He measured the SEP of these PMTs and then raised the LED to a fixed higher voltage. He then found the number of photoelectrons from the histogram. He then compared a number of PMTs. We have fewer PMTs but will do similar tests. | ||
Latest revision as of 18:07, 27 June 2012
| ⇐ Back to Summer 2012 page |
| ⇐ Back to the Main_Page |
Quantum Efficiency
Every PMT has a so-called "quantum efficiency" associated with it. These is the efficiency of the PMT photocathode window converting photons into electrons quantum mechanically via the photoelectric effect.
Typically these percentages hover around ~20%. In any case, it is an important property to know about the PMTs that will be used for the Kaon Aerogel Cherenkov Detector.
JLab-Yerevan Results
Tests have been conducted at JLab by our collaborators in the Yerevan group that characterize the quantum efficiency of our PMTs. The PMTs that we plan to use were used in the BLAST experiment at MIT/Bates. The test was a relative quantum efficiency test and it compared the BLAST PMTs to spare HMS PMTs that had not been used. T
he results were quite interesting. Hopefully, you may view their plot below. Figure credit goes to Dr. Hamlet Mkrtchyan and the Yerevan Group. I took the figure from their eLog.

|
CUA Cross-check
Hamlet invited others to redo the tests and investigate this puzzle, and indeed it is important for the performance of our detector to understand the quantum efficiencies of our PMTs.
The first step is to run some tests to compare the JLab and CUA setups. Simple Gain tests with an LED suffice for this. These tests are documented in the CODA Logbook on this wiki
And here is a figure of the three setups Gain measurements for one PMT (#9561). The triangles are JLab, the dark squares are Dark Box 1 (wood) and then light squares are Dark Box 2 (plastic)

|
Procedure
The procedure for these tests will be much like Hamlet's. He measured the SEP of these PMTs and then raised the LED to a fixed higher voltage. He then found the number of photoelectrons from the histogram. He then compared a number of PMTs. We have fewer PMTs but will do similar tests.