Difference between revisions of "MainPage:Nuclear:Summer2012:RefractiveIndex"
| Line 26: | Line 26: | ||
== Results == | == Results == | ||
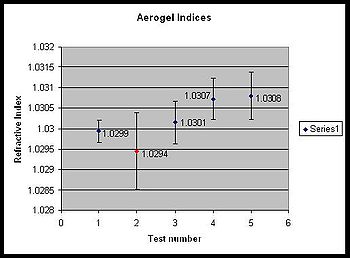
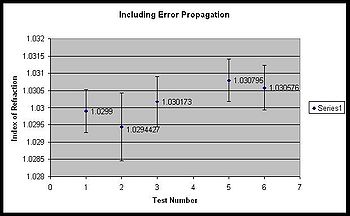
| − | [[File:first-five-tests.jpg|thumb| | + | [[File:first-five-tests.jpg|thumb||350px|The results of our first five tests. This does not include uncertainty propagation.]] [[File:first five with error prop.jpg|thumb||350px|The results of our first six tests. These are from the same measurements as the graph to the left (except we have added one more result), but now include uncertainty propagation.]] |
| + | |||
| − | |||
We have done several tests and all of them have fairly small error and are very close to the expected value, 1.03. The average uncertainty in the left graph is 0.0005616, without uncertainty propagation. After including the uncertainty propagation, the graph on the right shows an average uncertainty of 0.0007216. Uncertainty propagation provides larger uncertainty, but more accurate and realistic results. | We have done several tests and all of them have fairly small error and are very close to the expected value, 1.03. The average uncertainty in the left graph is 0.0005616, without uncertainty propagation. After including the uncertainty propagation, the graph on the right shows an average uncertainty of 0.0007216. Uncertainty propagation provides larger uncertainty, but more accurate and realistic results. | ||
Revision as of 09:32, 12 July 2012
| ⇐ Back to Summer 2012 page |
| ⇐ Back to the Main_Page |
About Our Work
The index of refraction is a property of a material which dictates how quickly light travels through that material. As light passes through a material with one index of refraction to a material with a different index of refraction, the light changes speed and "bends" as it changes mediums. When light travels from a material with a low index of refraction to one with a high index of refraction, the light is bent toward the normal, and vice verse. We are working to measure the index of refraction of aerogel to a very high degree of precision. This value is significant because the aerogel will be used as a particle identification system in the Kaon Aerogel Detector at JLab to distinguish between Kaons and Protons according to their momentum.
Measurement Set-up
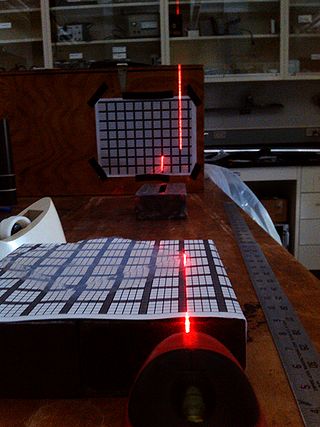
We use a set-up with graph paper, a laser, aerogel, and measuring tools. The index of refraction can be measured using only the incident angle, the distance between the aerogel and a screen, and the amount the light is shifted on the screen after the aerogel is placed in front of the laser.
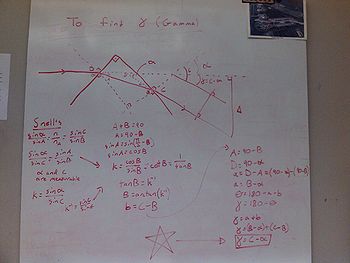
The equation for calculating gamma based on the incident angle is ɣ = ɑ - (π/2) + arcsin[n•sin((π/2)-arcsin(sin(ɑ)/n))]
We can then use this equation to calculate the index of refraction; n = (sin2(ɑ) + cos2(ɣ - ɑ))½
Finding Error
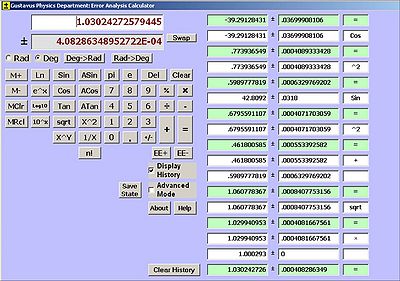
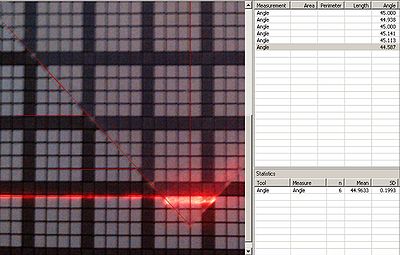
We have worked meticulously to reduce the error in our measurements and have significantly reduced our uncertainty. The next step is to include error propagation in our calculations which will account for the accumulative uncertainties of multiple measurements. We have done the uncertainty propagation by hand, but find it much more convenient to use a computer program to help with the tedious calculations. To help further reduce our error, we have started using image analysis software. This allows us to take a picture of our aerogel sample and very accurately measure the incident angle of our laser.
Results
We have done several tests and all of them have fairly small error and are very close to the expected value, 1.03. The average uncertainty in the left graph is 0.0005616, without uncertainty propagation. After including the uncertainty propagation, the graph on the right shows an average uncertainty of 0.0007216. Uncertainty propagation provides larger uncertainty, but more accurate and realistic results.
Prove it
We have worked through a couple of proofs for our experiments, both with our co-workers and on our own. The first proof was one for the equations for gamma and the index of refraction (using gamma in that equation). This was a mathematically straightforward proof, relying only on geometry and trigonometry, but was quite complicated. The calculations assume that the tiles are rectangular, that is, they have corners that are ninety degrees angles. None of our calculations take into account any dispersion factors that may arise from different wavelengths of light being used in the measurement.
The second proof was spearheaded by Daniel and focuses on finding the angle gamma using a different method from the first proof. This is very useful for reducing our uncertainty and giving us methods to double check our measurements. Our second proof is also being used to find if there is a constant vertex for the angle gamma that may be a function of distance, laser displacement, and the incident angle.
