Difference between revisions of "MainPage:Nuclear:Summer2012:RefractiveIndex"
| (6 intermediate revisions by the same user not shown) | |||
| Line 1: | Line 1: | ||
| − | {|border="1" cellpadding="2" cellspacing="0" style="background-color: | + | {|border="1" cellpadding="2" cellspacing="0" style="background-color:lightblue" |
| <font size="2">'''[[MainPage:Nuclear:Summer2012|⇐ Back to Summer 2012 page]]'''</font> | | <font size="2">'''[[MainPage:Nuclear:Summer2012|⇐ Back to Summer 2012 page]]'''</font> | ||
|- | |- | ||
| Line 41: | Line 41: | ||
== Results == | == Results == | ||
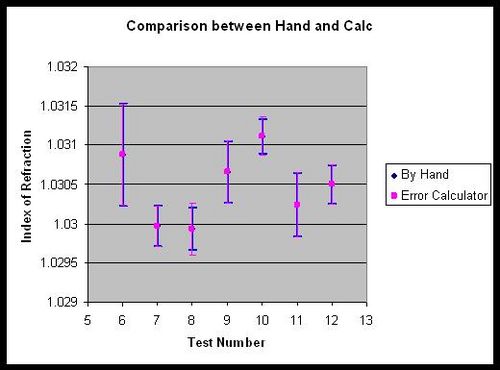
| + | [[File:box one compare.jpg|thumb|right|380px|A comparison of the two tiles in Box 1. There is a clear dividing line between the indices of refraction for the different tiles. The data points were arranged in increasing index of refraction for both tiles.]] | ||
| − | |||
[[File:equal histogram.jpg|thumb|left|580px|All of our tests on 1.03 index of refraction aerogel tiles are compiled into this Histogram. Each test was given the same number of counts to put on the histogram, but the uncertainty determined how spread or concentrated those counts would be.]] | [[File:equal histogram.jpg|thumb|left|580px|All of our tests on 1.03 index of refraction aerogel tiles are compiled into this Histogram. Each test was given the same number of counts to put on the histogram, but the uncertainty determined how spread or concentrated those counts would be.]] | ||
| Line 73: | Line 73: | ||
| − | We have done several tests and all of them have fairly small error and are very close to the expected values. We have done at least two tests on each of the 1.03 index tiles and have done three tests on one of the 1.02 tiles. We also ran four tests on the two tiles in Box 01 and got the interesting results seen in the graph | + | We have done several tests and all of them have fairly small error and are very close to the expected values. We have done at least two tests on each of the 1.03 index tiles and have done three tests on one of the 1.02 tiles. We also ran four tests on the two tiles in Box 01 and got the interesting results seen in the graph above-right. Although each tile has an index of refraction very close to 1.03, there is some difference between the tiles. Despite slight variations between tiles, the results are fairly consistent. Our average index of refraction for the 1.03 tiles is 1.030251. |
| − | [[File: | + | |
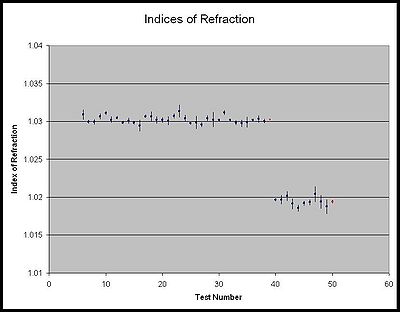
| + | [[File:july 25 tests 6-38.jpg|thumb|center|400px|This is a scatter plot of our tests so far. Tests 1-38 are of 1.03 tiles while tests 40-49 are of 1.02 index tiles. The two red data points indicate the average of their respective indices. It is worth noting that the first red data point was made smaller, but is still too big to show the error bars. For that point, the error is roughly the size of the marker.]] | ||
== Prove it == | == Prove it == | ||
Latest revision as of 14:12, 31 July 2012
| ⇐ Back to Summer 2012 page |
| ⇐ Back to the Main_Page |
About Our Work
The index of refraction is a property of a material which dictates how quickly light travels through that material. As light passes through a material with one index of refraction to a material with a different index of refraction, the light changes speed and "bends" as it changes mediums. When light travels from a material with a low index of refraction to one with a high index of refraction, the light is bent toward the normal, and vice versa. We are working to measure the index of refraction of aerogel to a very high degree of precision. This value is significant because the aerogel will be used as a particle identification system in the Kaon Aerogel Detector at JLab to distinguish between Kaons and Protons according to their momentum.
Measurements
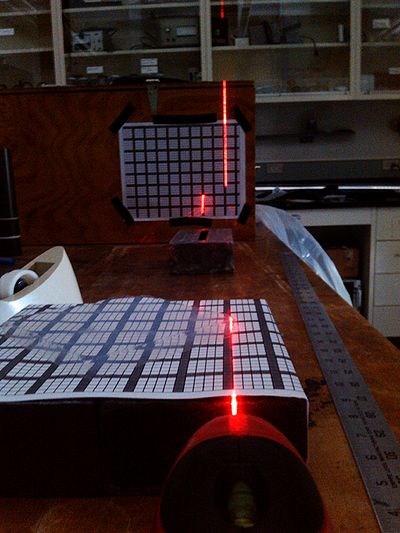
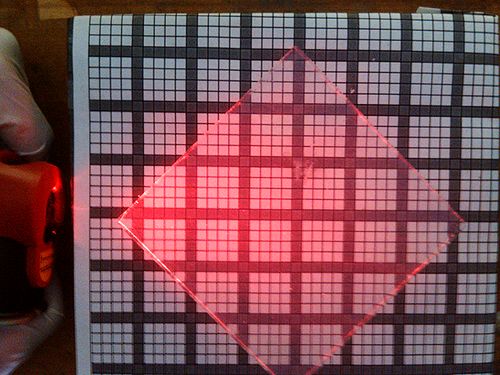
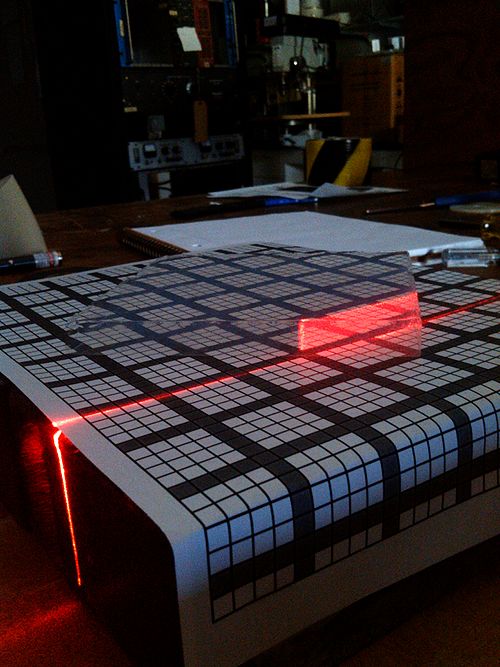
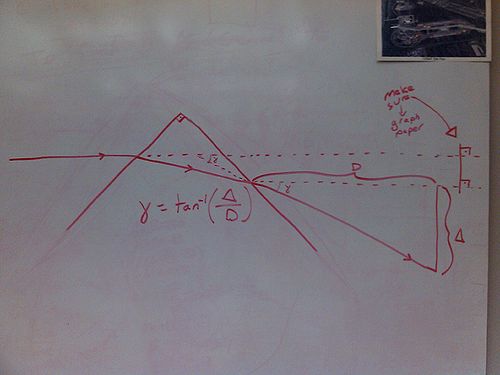
We use a set-up with graph paper, a laser, aerogel, and measuring tools. The index of refraction can be measured using only the incident angle, the distance between the aerogel and a screen, and the amount the light is shifted on the screen after the aerogel is placed in front of the laser. We do our calculation for the index of refraction using three measurements:
1) We measure the distance between the aerogel and our screen using a yard stick. Since we do not know the exact position of gamma's vertex, but we know it is somewhere inside the aerogel, we measure two distances; from the laser's enter point to the screen, and from the laser's exit point to the screen. The two distances give us our error which is usually on the scale of five to ten millimeters.
2) Calipers are used to measure the displacement of the laser on the screen (delta) so that we have a very precise measurement. To find the error in our measurement, we take a couple of measurements, average the numbers, and subtract the most extreme value (largest or smallest) from the average to get the error. There is usually less than 0.6 millimeters. To account for the beam width, we take measurements from the left side of the original beam to the left side of the refracted beam, and the same for the right sides. We can do this because we know the beams do not cross, and this helps account for any uncertainty.
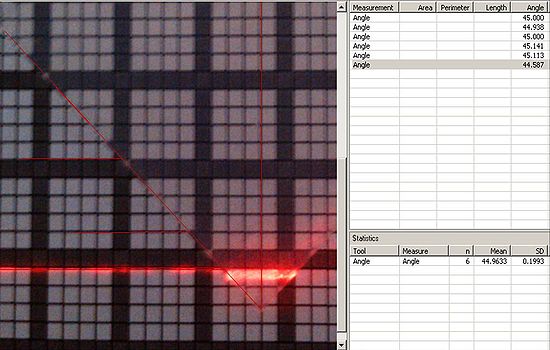
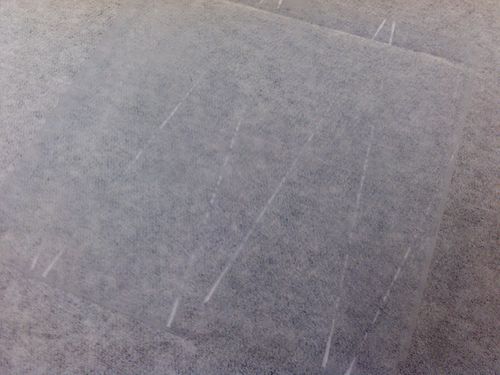
3) The incident angle has a very large impact on the uncertainty of the refractive index. The equations become sensitive to uncertainty in alpha the further the angle is from 45°. To measure our incident angle, we take a picture of the aerogel sitting on graph paper. We then use multiple measurements with image analysis to find the angle and the uncertainty of the angle.
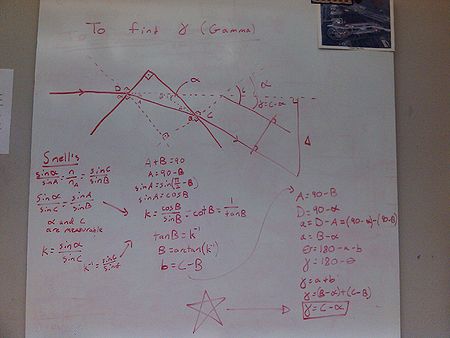
The equation for calculating gamma based on the incident angle is; ɣ = ɑ - (π/2) + arcsin[n•sin((π/2) - arcsin(sin(ɑ)/n))]
We can then use this equation to calculate the index of refraction; n = √(sin^2(ɑ) + cos^2(ɣ - ɑ))
Uncertainty Propagation
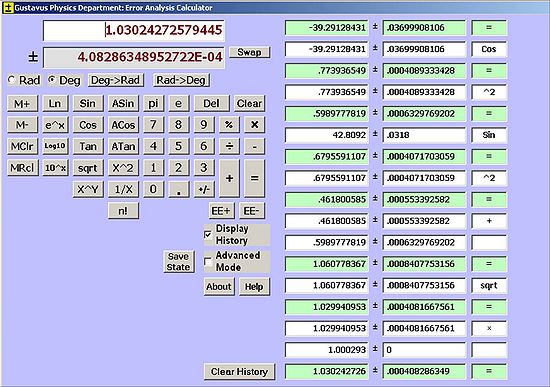
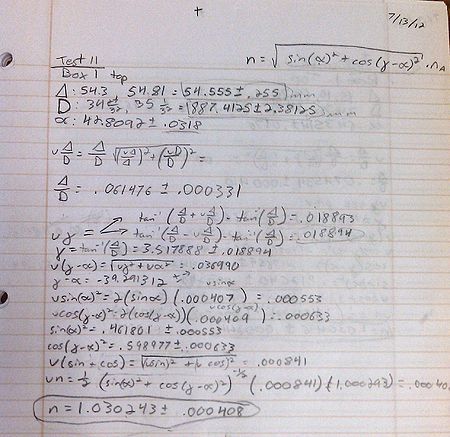
We have worked meticulously to reduce the error in our measurements and have significantly reduced our uncertainty. The next step is to include error propagation in our calculations which will account for the accumulative uncertainties of multiple measurements. We have done the uncertainty propagation by hand, but find it much more convenient to use a computer program to help with the tedious calculations. To make sure that this calculator is valid, we have compared answers from multiple tests where we did the error propagation by hand and on the calculator. To help further reduce our error, we have started using image analysis software. This allows us to take a picture of our aerogel sample and very accurately measure the incident angle of our laser.
Results
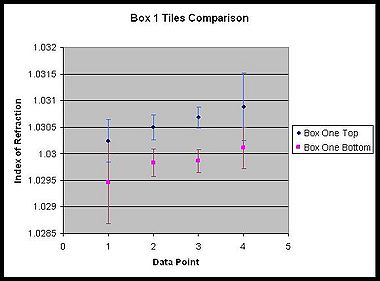
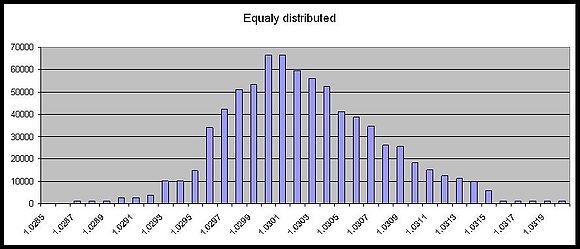
We have done several tests and all of them have fairly small error and are very close to the expected values. We have done at least two tests on each of the 1.03 index tiles and have done three tests on one of the 1.02 tiles. We also ran four tests on the two tiles in Box 01 and got the interesting results seen in the graph above-right. Although each tile has an index of refraction very close to 1.03, there is some difference between the tiles. Despite slight variations between tiles, the results are fairly consistent. Our average index of refraction for the 1.03 tiles is 1.030251.
Prove it
We have worked through a couple of proofs for our experiments, both with our co-workers and on our own. The first proof was one for the equations for gamma and the index of refraction (using gamma in that equation). This was a mathematically straightforward proof, relying only on geometry and trigonometry, but was quite complicated. The calculations assume that the tiles are rectangular, that is, they have corners that are ninety degrees angles. None of our calculations take into account any dispersion factors that may arise from different wavelengths of light being used in the measurement.
The second proof was spearheaded by Daniel and focuses on finding the angle gamma using a different method from the first proof. This is very useful for reducing our uncertainty and giving us methods to double check our measurements. We are still unsure whether we can find if there is a constant vertex for the angle gamma that may be a function of distance, laser displacement, and the incident angle.
Transparency Testing
Our next task is to assess the transparency of our aerogel tiles. Initial thoughts for the test set-up include placing a PMT in the dark box with and L.E.D. and measuring the number of photons, then placing aerogel between the PMT and the L.E.D. and measuring the decrease in photons counted by the PMT.
Resources
Image analysis software: Digimizer -- http://www.digimizer.com/
Uncertainty Propagation calculator: Gustavus Adolphus College -- http://physics.gac.edu/~huber/error_calc/
Pictures
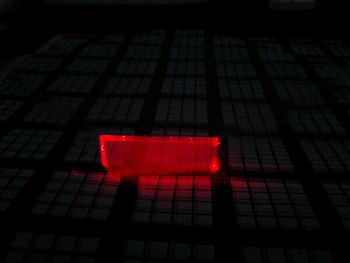
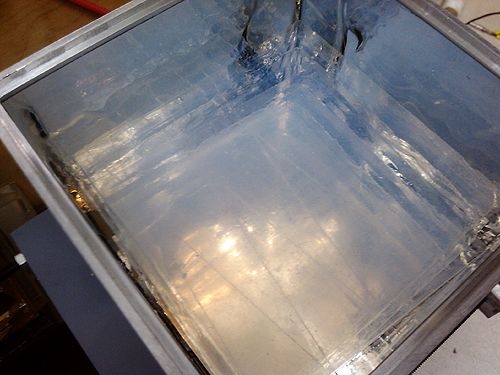
A bunch of pictures of cool lasers and aerogel. Enjoy!
