Difference between revisions of "File:Example.jpg"
Jump to navigation
Jump to search
(Fig. 1: The total count of coincidences, which are mostly muons, is displayed on the y axis, while time in hours is displayed on the x. The line of best fit shows a pretty steady trend, with no jumps occurring, but upon closer inspection, this does not ap) |
(uploaded a new version of "File:Example.jpg": Fig. 1: The total count of coincidences, which are mostly muons, is displayed on the y axis, while time in hours is displayed on the x. The line of best fit shows a pretty steady trend, with no j) |
(No difference)
| |
Latest revision as of 16:03, 10 July 2013
Fig. 1: The total count of coincidences, which are mostly muons, is displayed on the y axis, while time in hours is displayed on the x. The line of best fit shows a pretty steady trend, with no jumps occurring, but upon closer inspection, this does not appear to be the case.
File history
Click on a date/time to view the file as it appeared at that time.
| Date/Time | Thumbnail | Dimensions | User | Comment | |
|---|---|---|---|---|---|
| current | 16:03, 10 July 2013 | 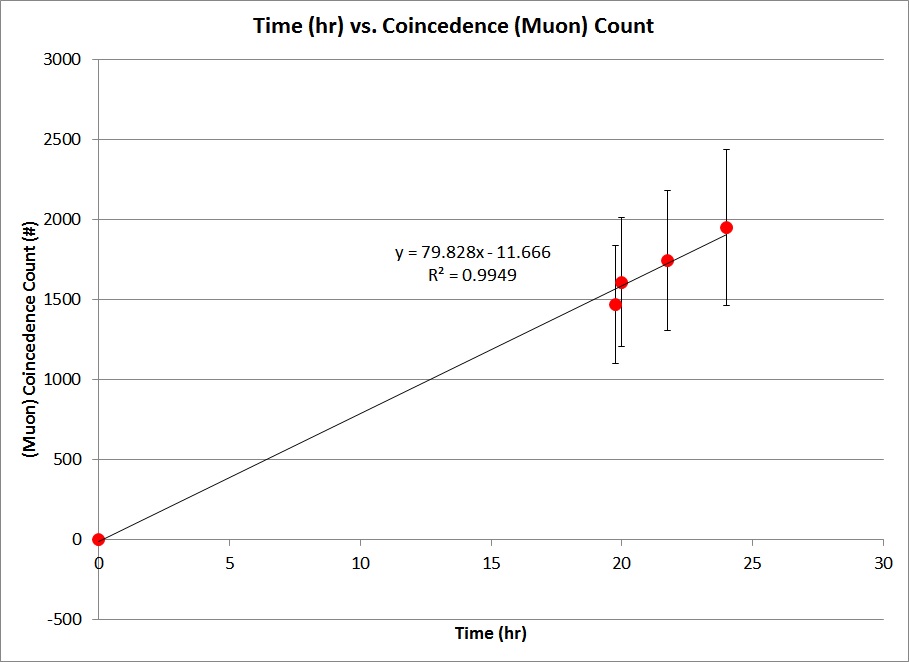 | 909 × 662 (72 KB) | Derek.j.boylan (talk | contribs) | Fig. 1: The total count of coincidences, which are mostly muons, is displayed on the y axis, while time in hours is displayed on the x. The line of best fit shows a pretty steady trend, with no jumps occurring, but upon closer inspection, this does not ap |
| 16:02, 10 July 2013 | 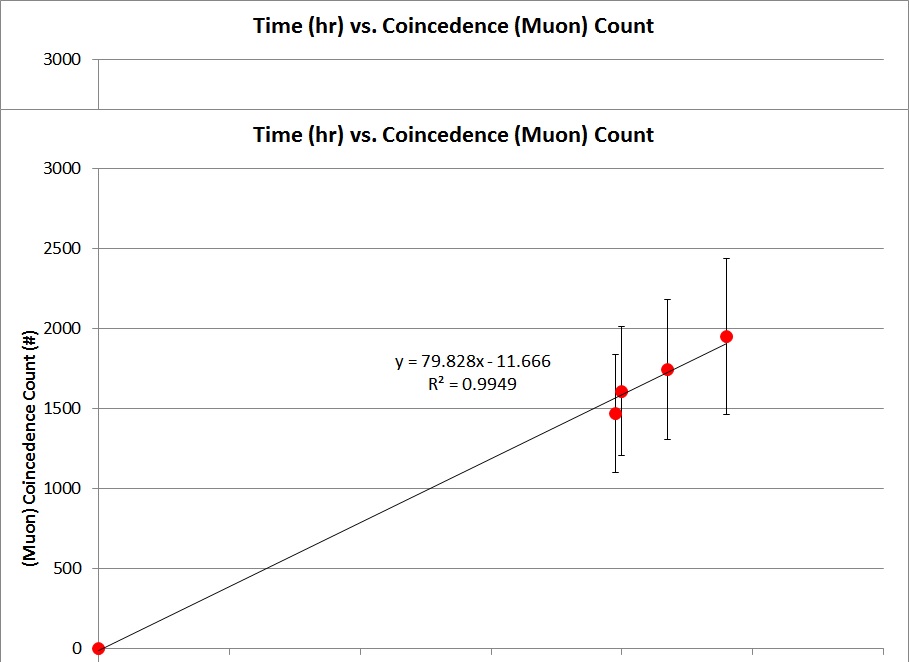 | 909 × 662 (73 KB) | Derek.j.boylan (talk | contribs) | Fig. 1: The total count of coincidences, which are mostly muons, is displayed on the y axis, while time in hours is displayed on the x. The line of best fit shows a pretty steady trend, with no jumps occurring, but upon closer inspection, this does not ap |
You cannot overwrite this file.
File usage
There are no pages that use this file.