Difference between revisions of "MainPage:Nuclear:NPS:PWO:CrystalLOG:CRYTUR01"
Jump to navigation
Jump to search
| Line 58: | Line 58: | ||
|- | |- | ||
| valign="top"| | | valign="top"| | ||
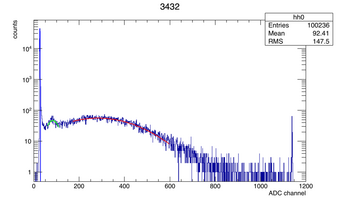
| − | [[File: |thumb|left|340px| | + | [[File:3432 c00.png|thumb|left|340px|Run 3432 taken on 11/29/2016: Fit of histogram with ~100K events.]] |
| + | |} | ||
| + | {|border="0" style="text-align:center;" width="100%" | ||
| + | |- | ||
| + | | valign="top"| | ||
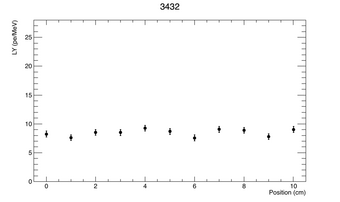
| + | [[File:3432.png|thumb|left|340px| Run 3432 taken on 11/29/2016: LY as a function of peak position.]] | ||
|} | |} | ||
== Additional Data/Info== | == Additional Data/Info== | ||
Revision as of 21:32, 30 November 2016
| ⇐ Back to Crystal LOG |
| ⇐ Back to Neutral Particle Spectrometer |
| ⇐ Back to the Main_Page |
Time LOG
| Date | Experimenter(s) | Description | Comments |
|---|---|---|---|
| xx/xx/2015 | Marco | Wrapped | Preparing for light yield measurement. Approximately 5 layers of teflon tape, and 2 layers of black tape. |
| xx/xx/2015 | Marco | LY scan | ... |
| 12/14/2015 | Marco | unwrapped | Preparing for annealing. |
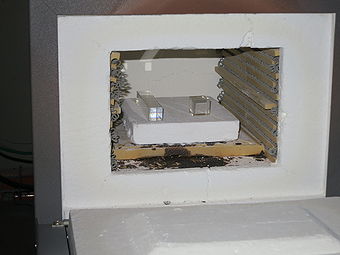
| 12/14/2015 | Marco | Thermal annealing | Starting 11:00AM. Ramp up at 18oC/hour until 200oC, stay at 200oC for 10 hours, ramp down at -18oC/hour. |
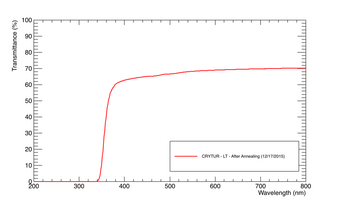
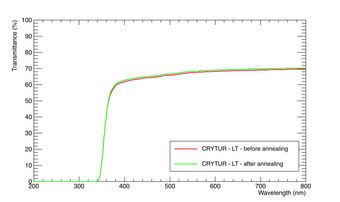
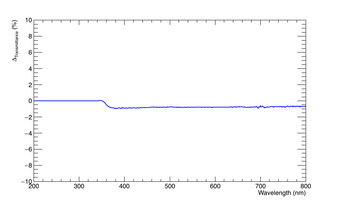
| 12/17/2015 | Marco | Longitudinal Transmittance | After annealing. |
| 07/15/2016 | Summer Students | Longitudinal Transmittance | Wavelength:200-800nm. |
| 08/11/2016 | Summer Students | LY scan | RUN:3411. Motor was lowered to approximately 5 cm down crystal. ~18oC. LY: 11.986 phe/MeV |
| 11/29/2016 | Salina | Light Yield | Run 3432: ~100K events; crystal wrapped with ~5 layers of teflon tape and 2 layers of black electrical tape. Steps of 20min, 1cm. T=18°C. LY = 8.23 ± 1.08 pe/MeV. Not enough statistics? Need to re-run with more stats (see pictures below) |
