Uploads by Ali
Jump to navigation
Jump to search
This special page shows all uploaded files.
| Date | Name | Thumbnail | Size | Description | Versions |
|---|---|---|---|---|---|
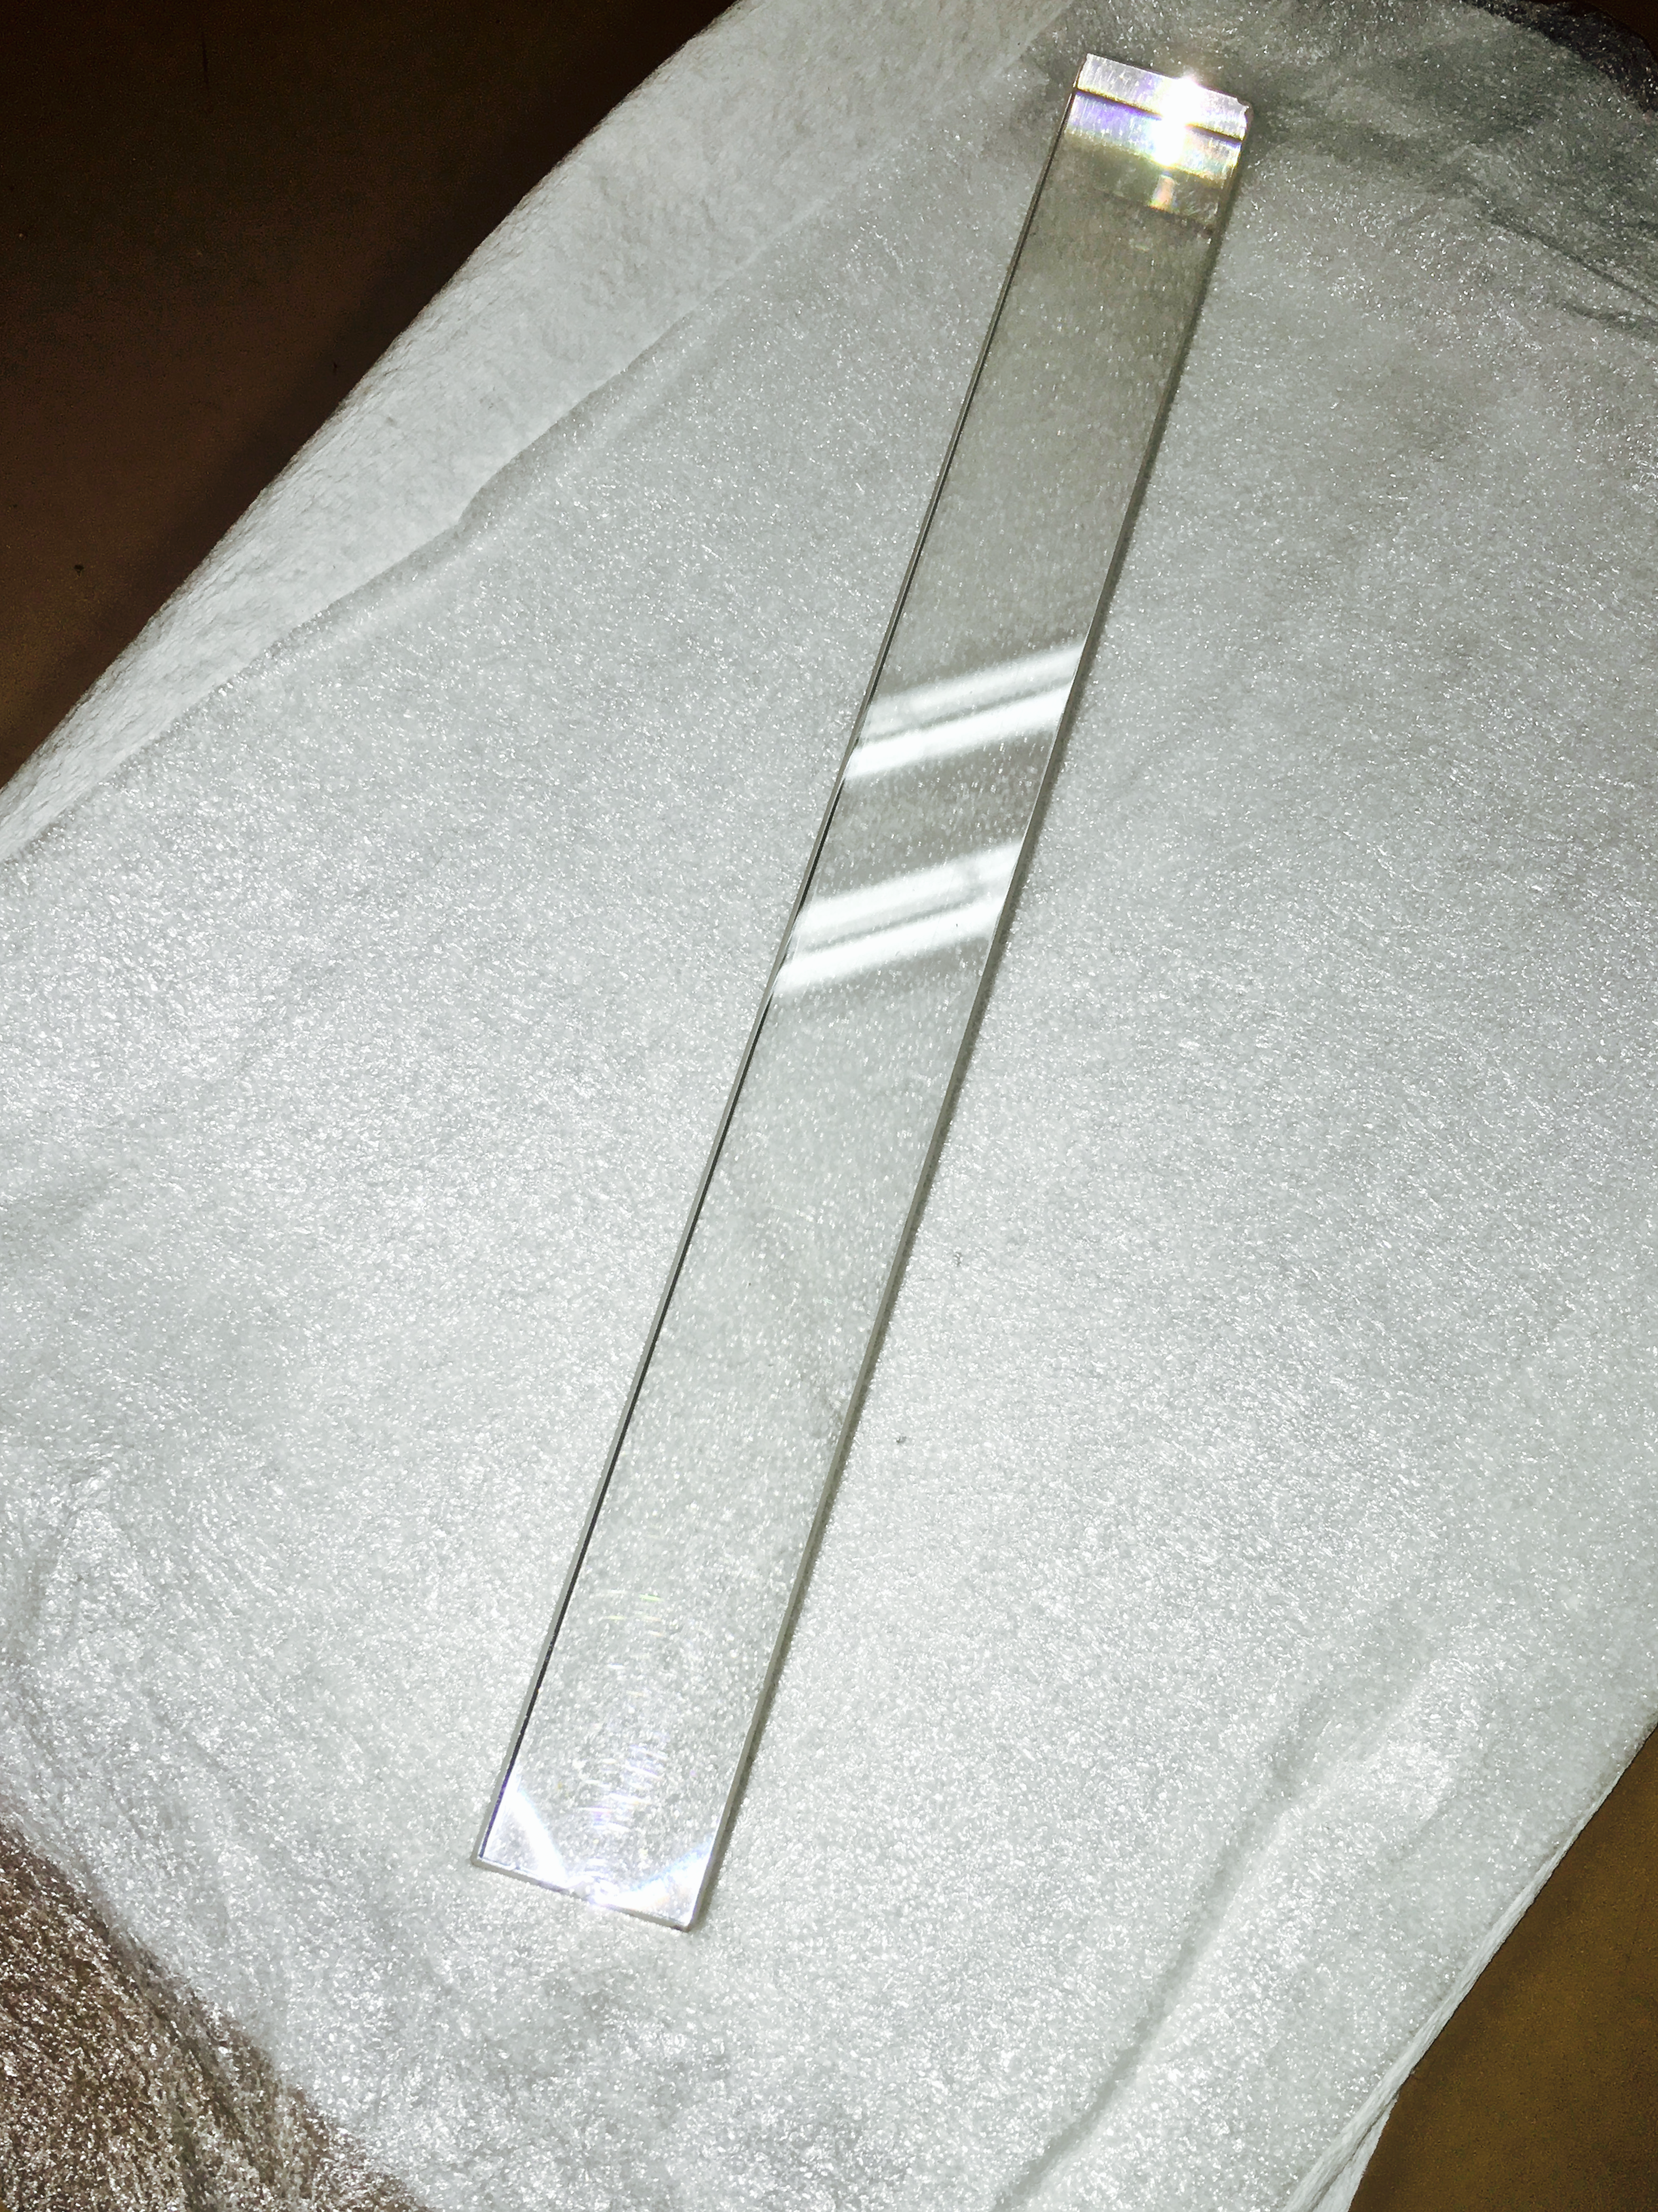
| 16:21, 28 January 2016 | Sicca 7.png (file) |  |
11.61 MB | 1 | |
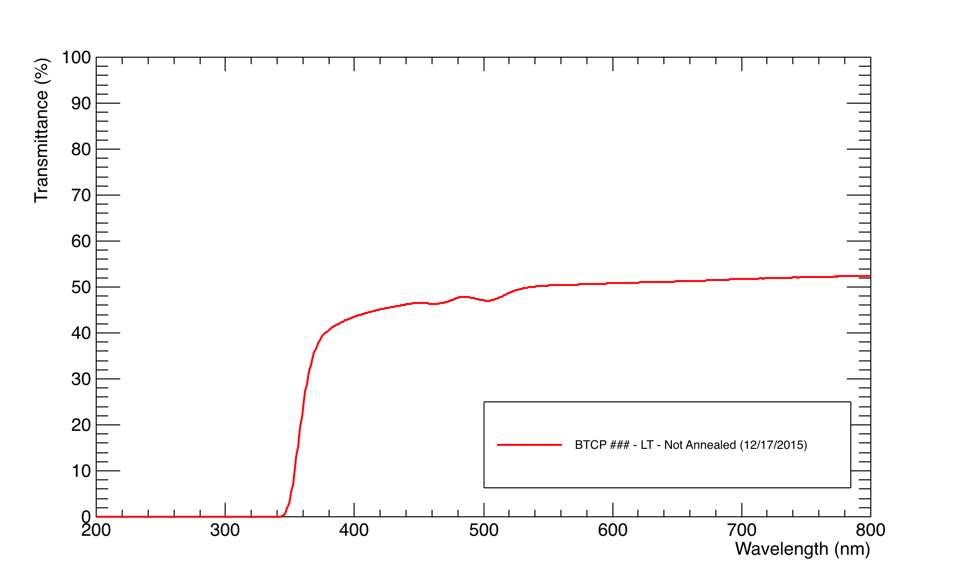
| 15:54, 28 January 2016 | BTCP 3 LT.png (file) |  |
41 KB | 1 | |
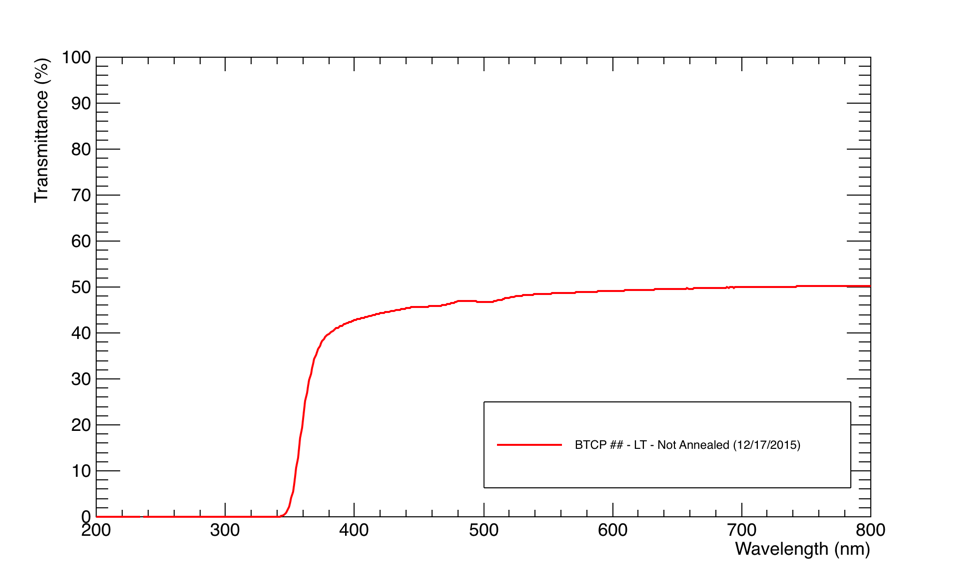
| 15:51, 28 January 2016 | BTCP 2 LT.png (file) |  |
40 KB | 1 | |
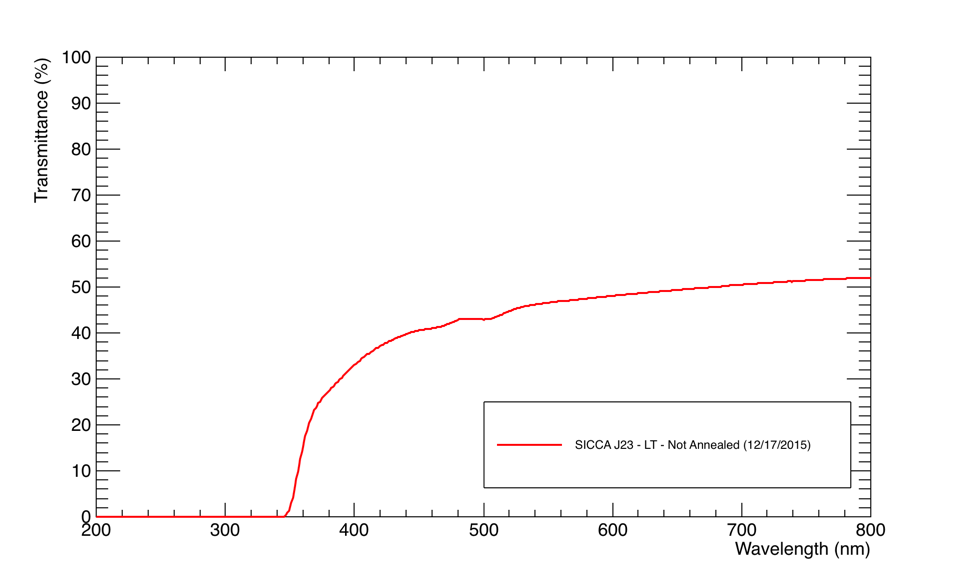
| 15:48, 28 January 2016 | SICCA J23 LT.png (file) |  |
41 KB | 1 | |
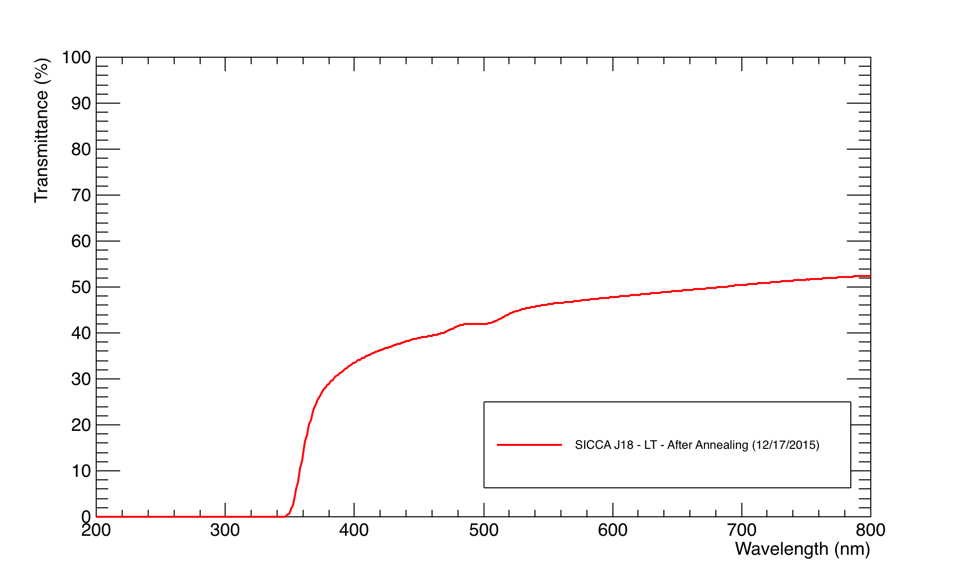
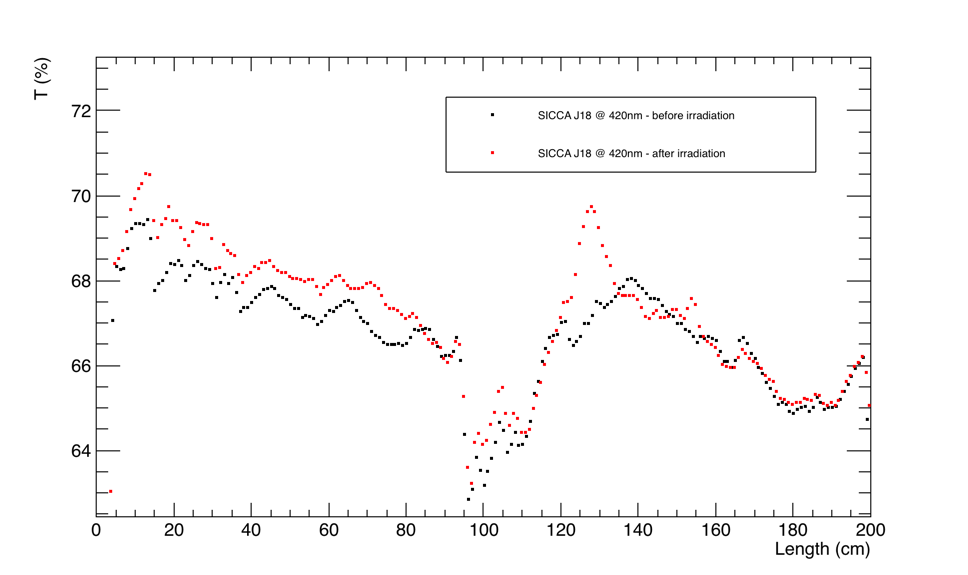
| 15:24, 28 January 2016 | SICCA J18 LT.png (file) |  |
41 KB | 1 | |
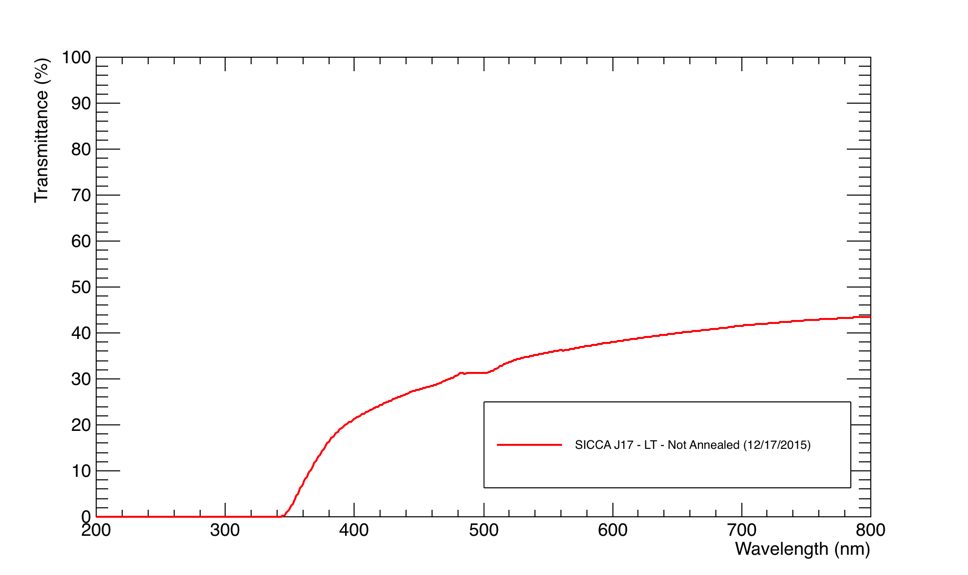
| 15:21, 28 January 2016 | SICCA J17 LT.png (file) |  |
41 KB | 1 | |
| 15:17, 28 January 2016 | SICCA 2 LT.png (file) |  |
41 KB | 1 | |
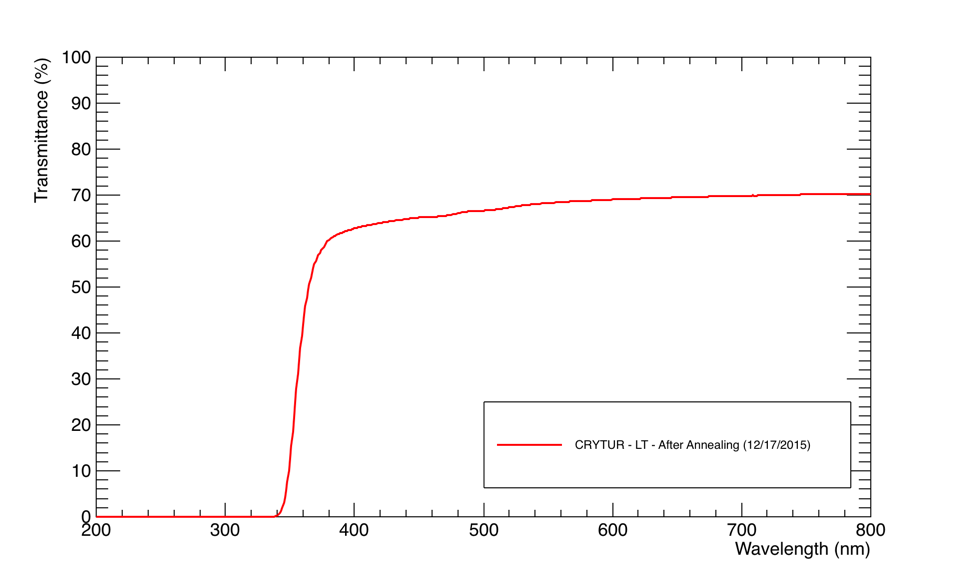
| 15:13, 28 January 2016 | CRYTUR LT.png (file) |  |
41 KB | 1 | |
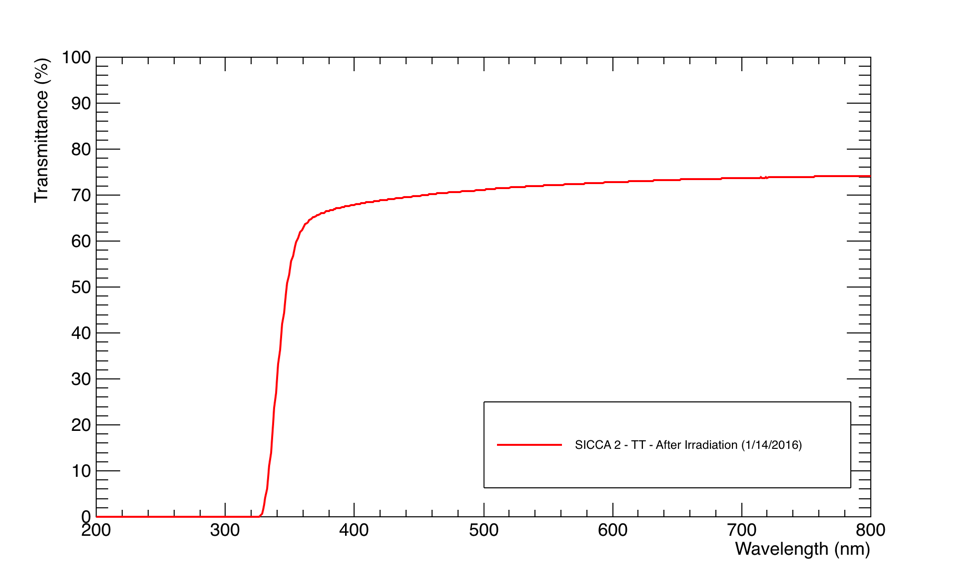
| 14:22, 28 January 2016 | SICCA 2 TT AI.png (file) |  |
41 KB | 1 | |
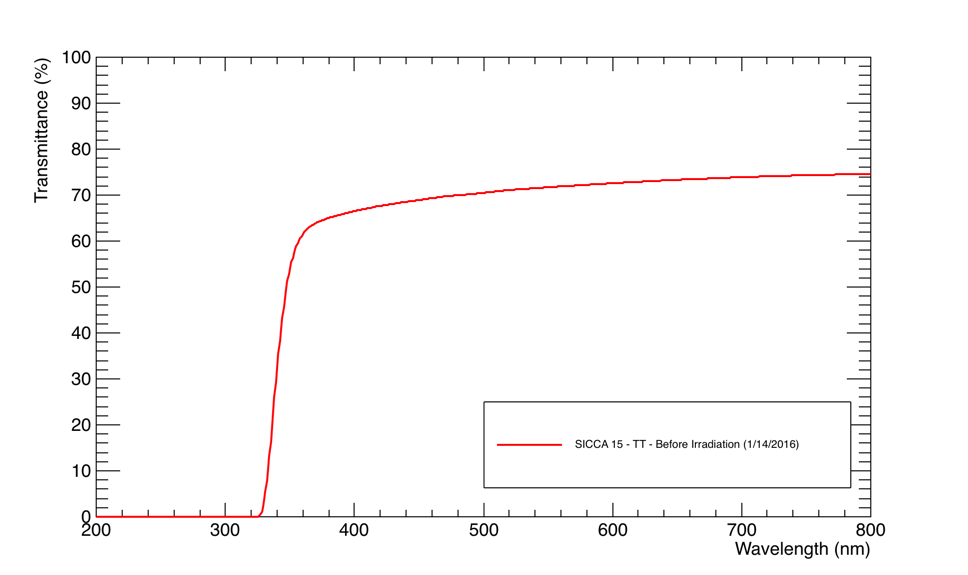
| 14:22, 28 January 2016 | SICCA 15 TT BI.png (file) |  |
41 KB | 1 | |
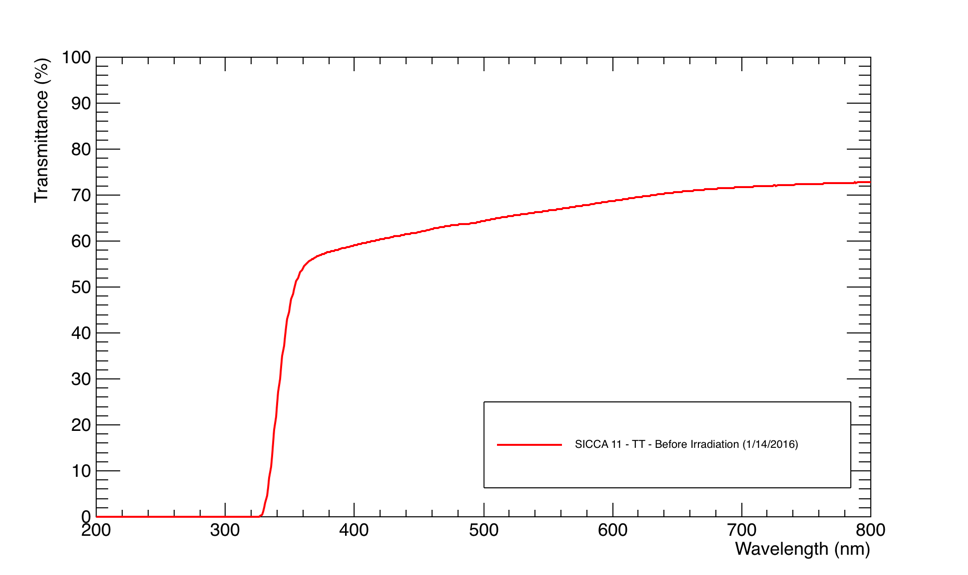
| 14:22, 28 January 2016 | SICCA 11 TT BI.png (file) |  |
42 KB | 1 | |
| 14:21, 28 January 2016 | SICCA 7 TT BI.png (file) |  |
42 KB | 1 | |
| 13:18, 19 January 2016 | Sicca 2 scan.png (file) |  |
50 KB | 1 | |
| 17:10, 15 January 2016 | Scan SICCAJ18.png (file) |  |
51 KB | 1 | |
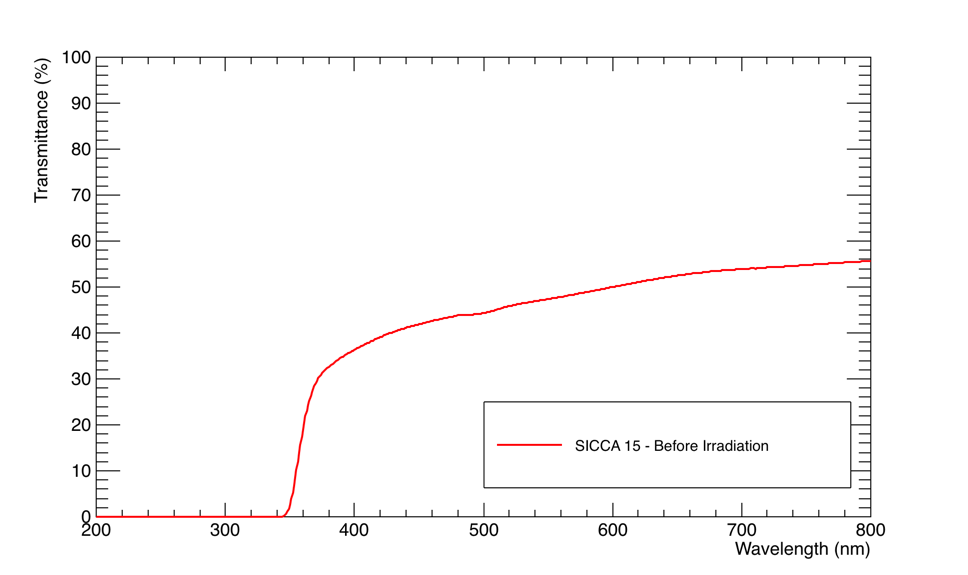
| 16:10, 15 January 2016 | SICCA 15 LT BI.png (file) |  |
41 KB | Longitudinal Transmittance of SICCA 15 crystal, before irradiation. | 1 |
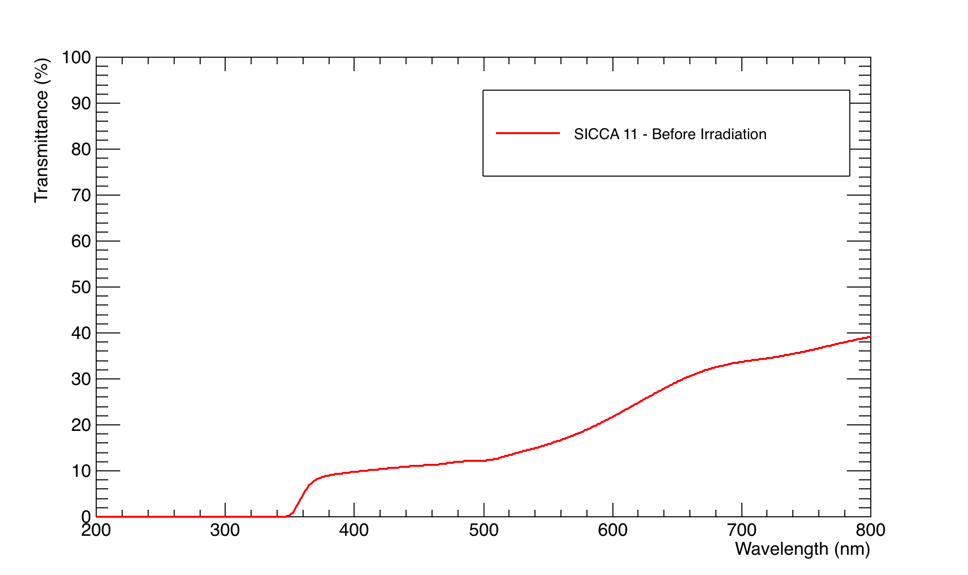
| 16:09, 15 January 2016 | SICCA 11 LT BI.png (file) |  |
40 KB | Longitudinal Transmittance of SICCA 11 crystal, before irradiation. | 1 |
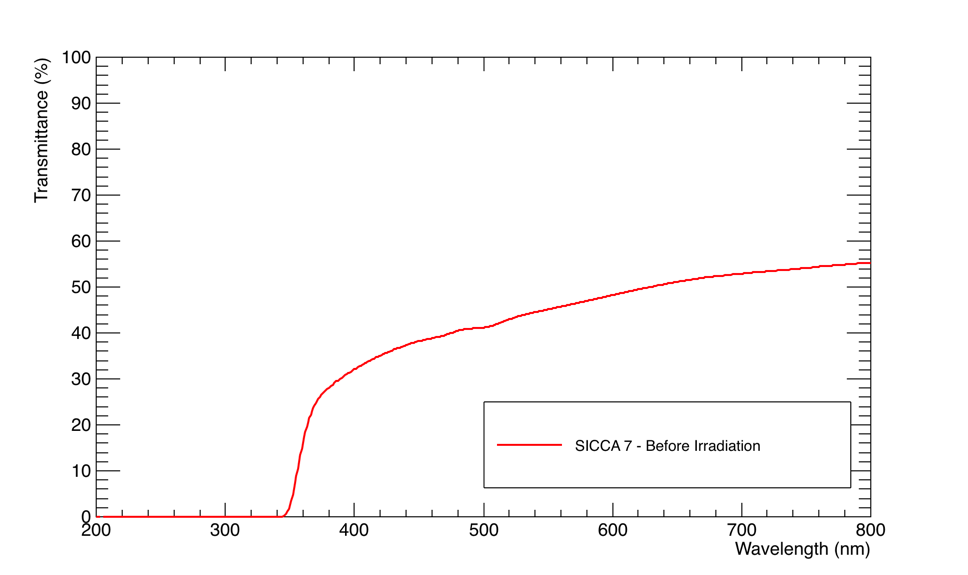
| 16:09, 15 January 2016 | SICCA 7 LT BI.png (file) |  |
41 KB | Longitudinal Transmittance of SICCA 7 crystal, before irradiation. | 1 |
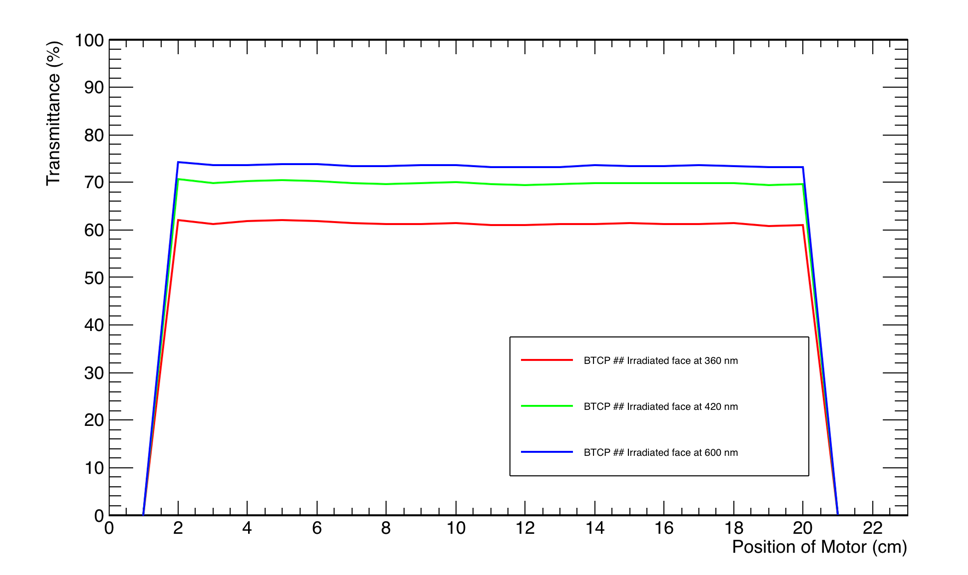
| 18:38, 11 January 2016 | Transvsposbtcp.png (file) | 60 KB | Graph showing transmittance of BTCP crystal at three different wavelengths: 360 nm (red), 420 nm (green), and 600 nm (blue). These wavelengths correspond to the different positions in cm of the motor . | 1 | |
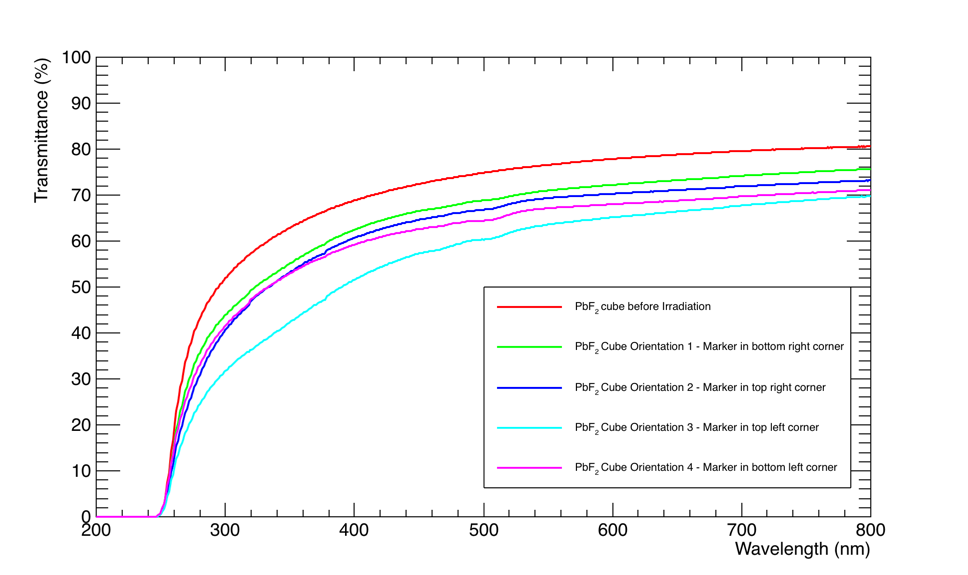
| 21:42, 12 December 2015 | Cube 1209015 both.png (file) |  |
78 KB | Graph showing the transmittance of the PbF2 cube that was a part of LED curing after several days, compared with the cube before irradiation (red). The cube surface that the LED light was focused on was marked (initially on the bottom right), and oriented | 1 |
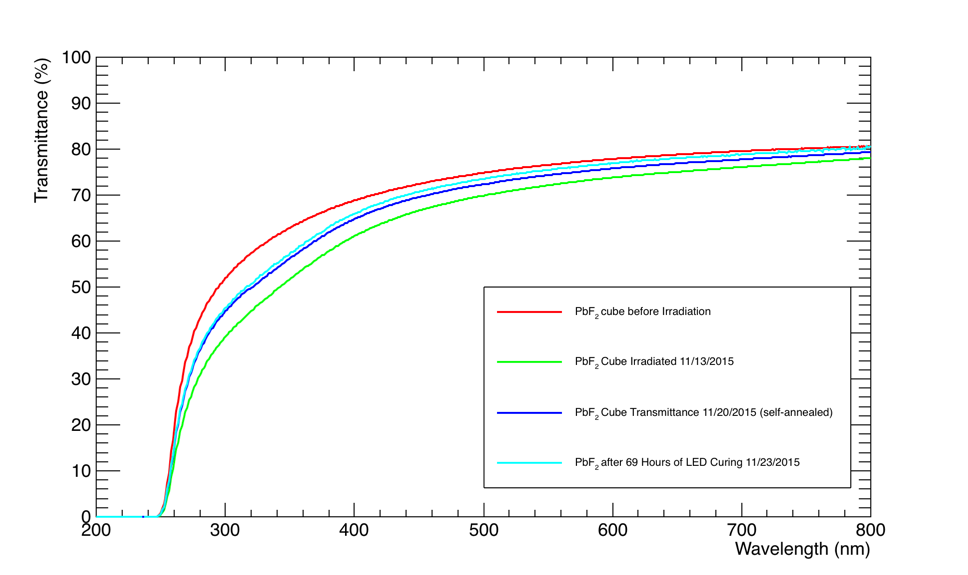
| 22:26, 23 November 2015 | Cube 5.png (file) |  |
69 KB | 1 | |
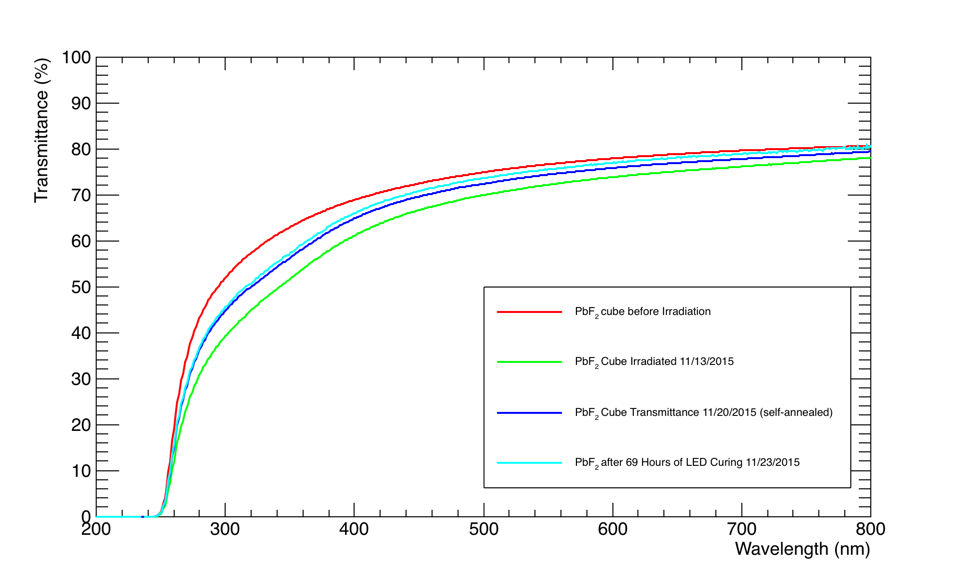
| 22:24, 23 November 2015 | Cube irrad afterirrad transmittance.png (file) | 68 KB | 1 | ||
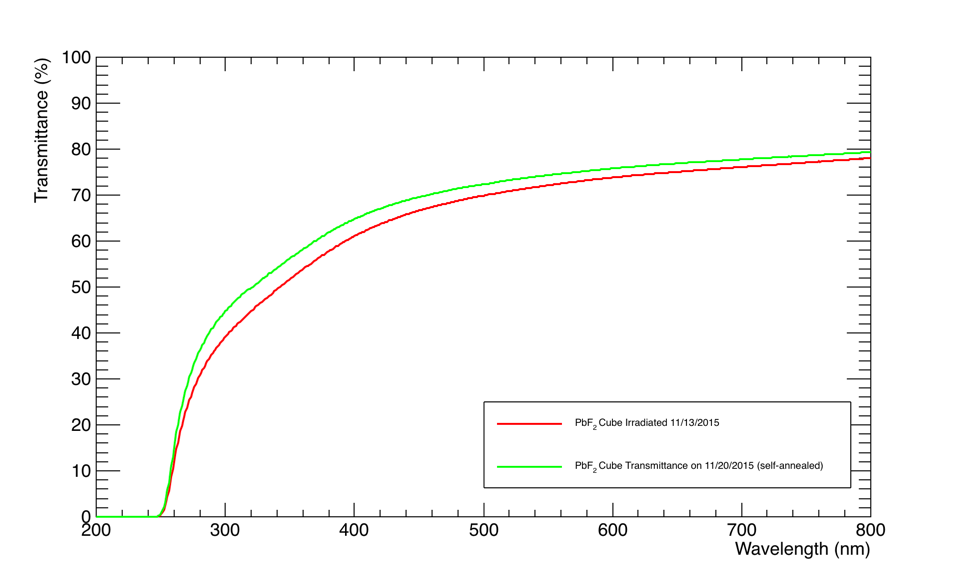
| 21:58, 23 November 2015 | Corrected after irrad pbf2crystal both.png (file) |  |
51 KB | 1 | |
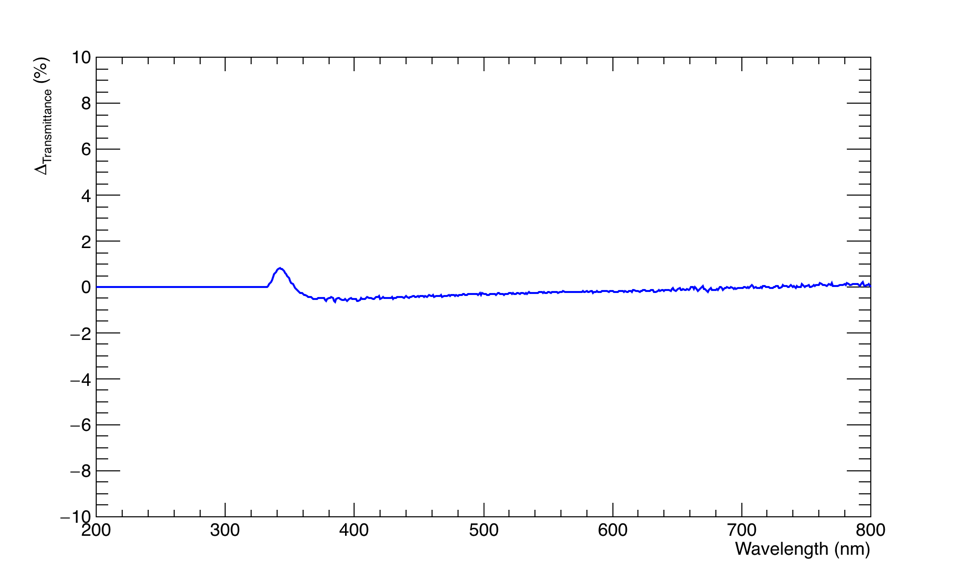
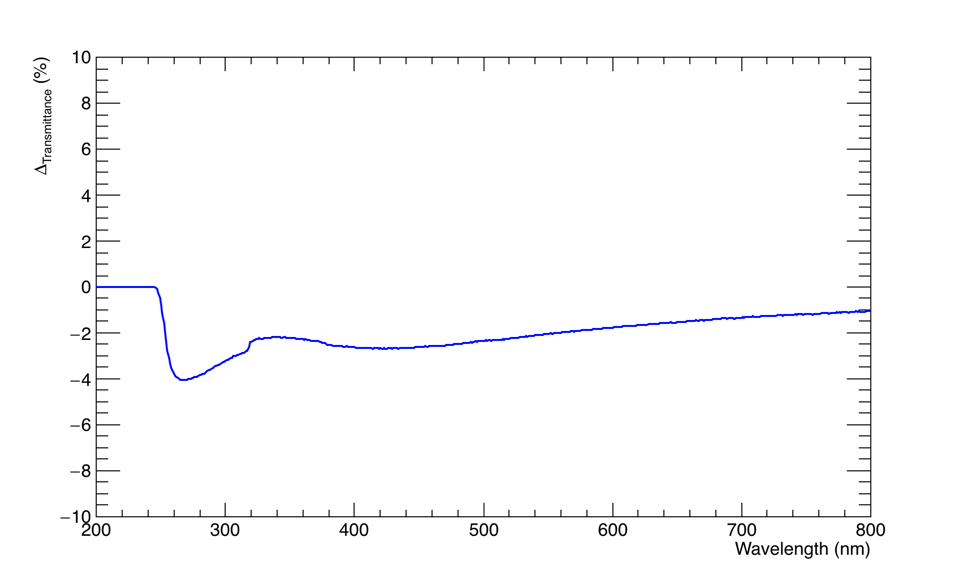
| 22:42, 13 November 2015 | Diff BTCP before and after irrad.png (file) |  |
34 KB | Graph showing the difference between the two measurements of the BTCP ## crystal before and after irradiation. | 1 |
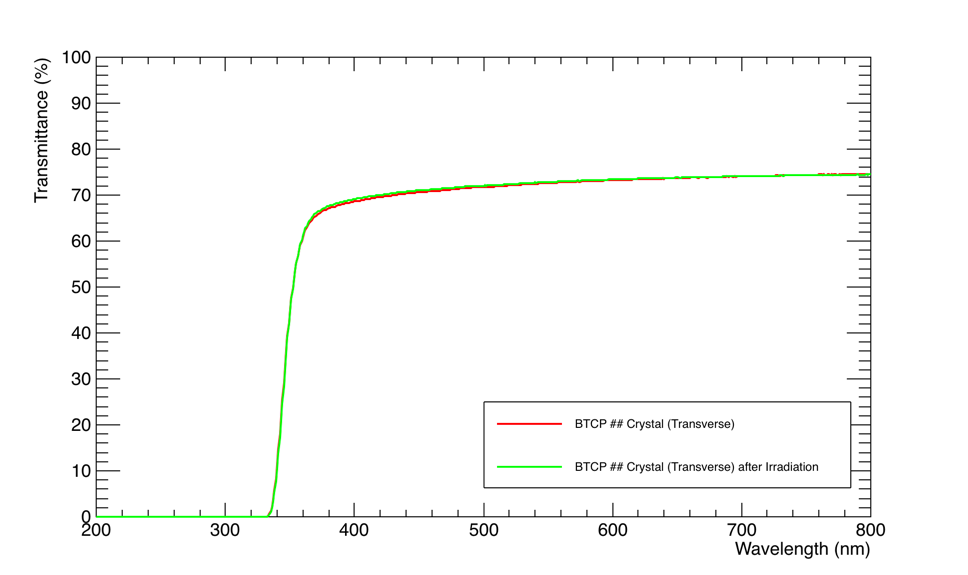
| 22:41, 13 November 2015 | BTCP before and after irrad.png (file) |  |
48 KB | Graph comparing two measurements of Transmittance (%) vs. Wavelength (nm) of BTCP ## crystal before irradiation (red) and after irradiation (green) centered at the sample compartment. | 1 |
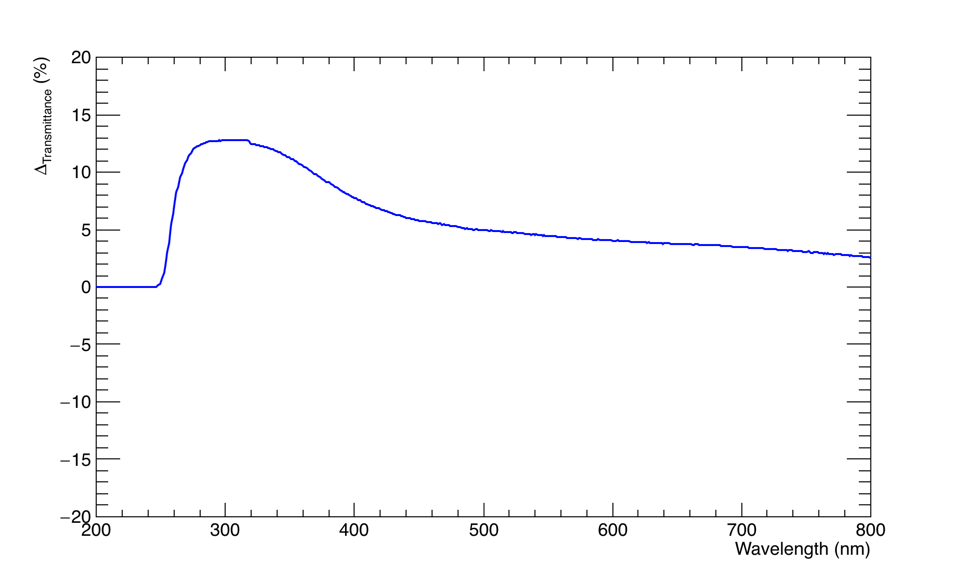
| 22:28, 13 November 2015 | DIFF pbf2cubebeforeandafterirrad.png (file) |  |
34 KB | Graph showing the difference between the two measurements of the PbF2 crystal cube. | 1 |
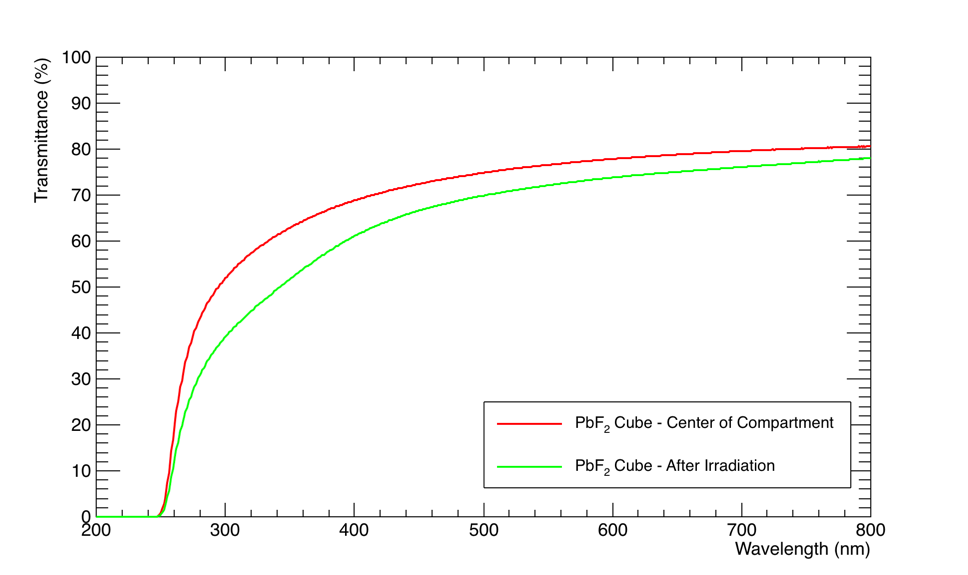
| 22:25, 13 November 2015 | Pbf2beforeandafterirrad.png (file) |  |
54 KB | Graph comparing two measurements of Transmittance (%) vs. Wavelength (nm) of PbF2 crystal cube before irradiation (red) and after irradiation (green) centered at the sample compartment. | 1 |
| 21:33, 13 November 2015 | Cube irradiated 2.jpg (file) |  |
203 KB | 1 | |
| 21:33, 13 November 2015 | Cube irradiated 1.jpg (file) |  |
752 KB | 1 | |
| 21:33, 13 November 2015 | Cube irradiated 3.jpg (file) |  |
1.68 MB | 1 | |
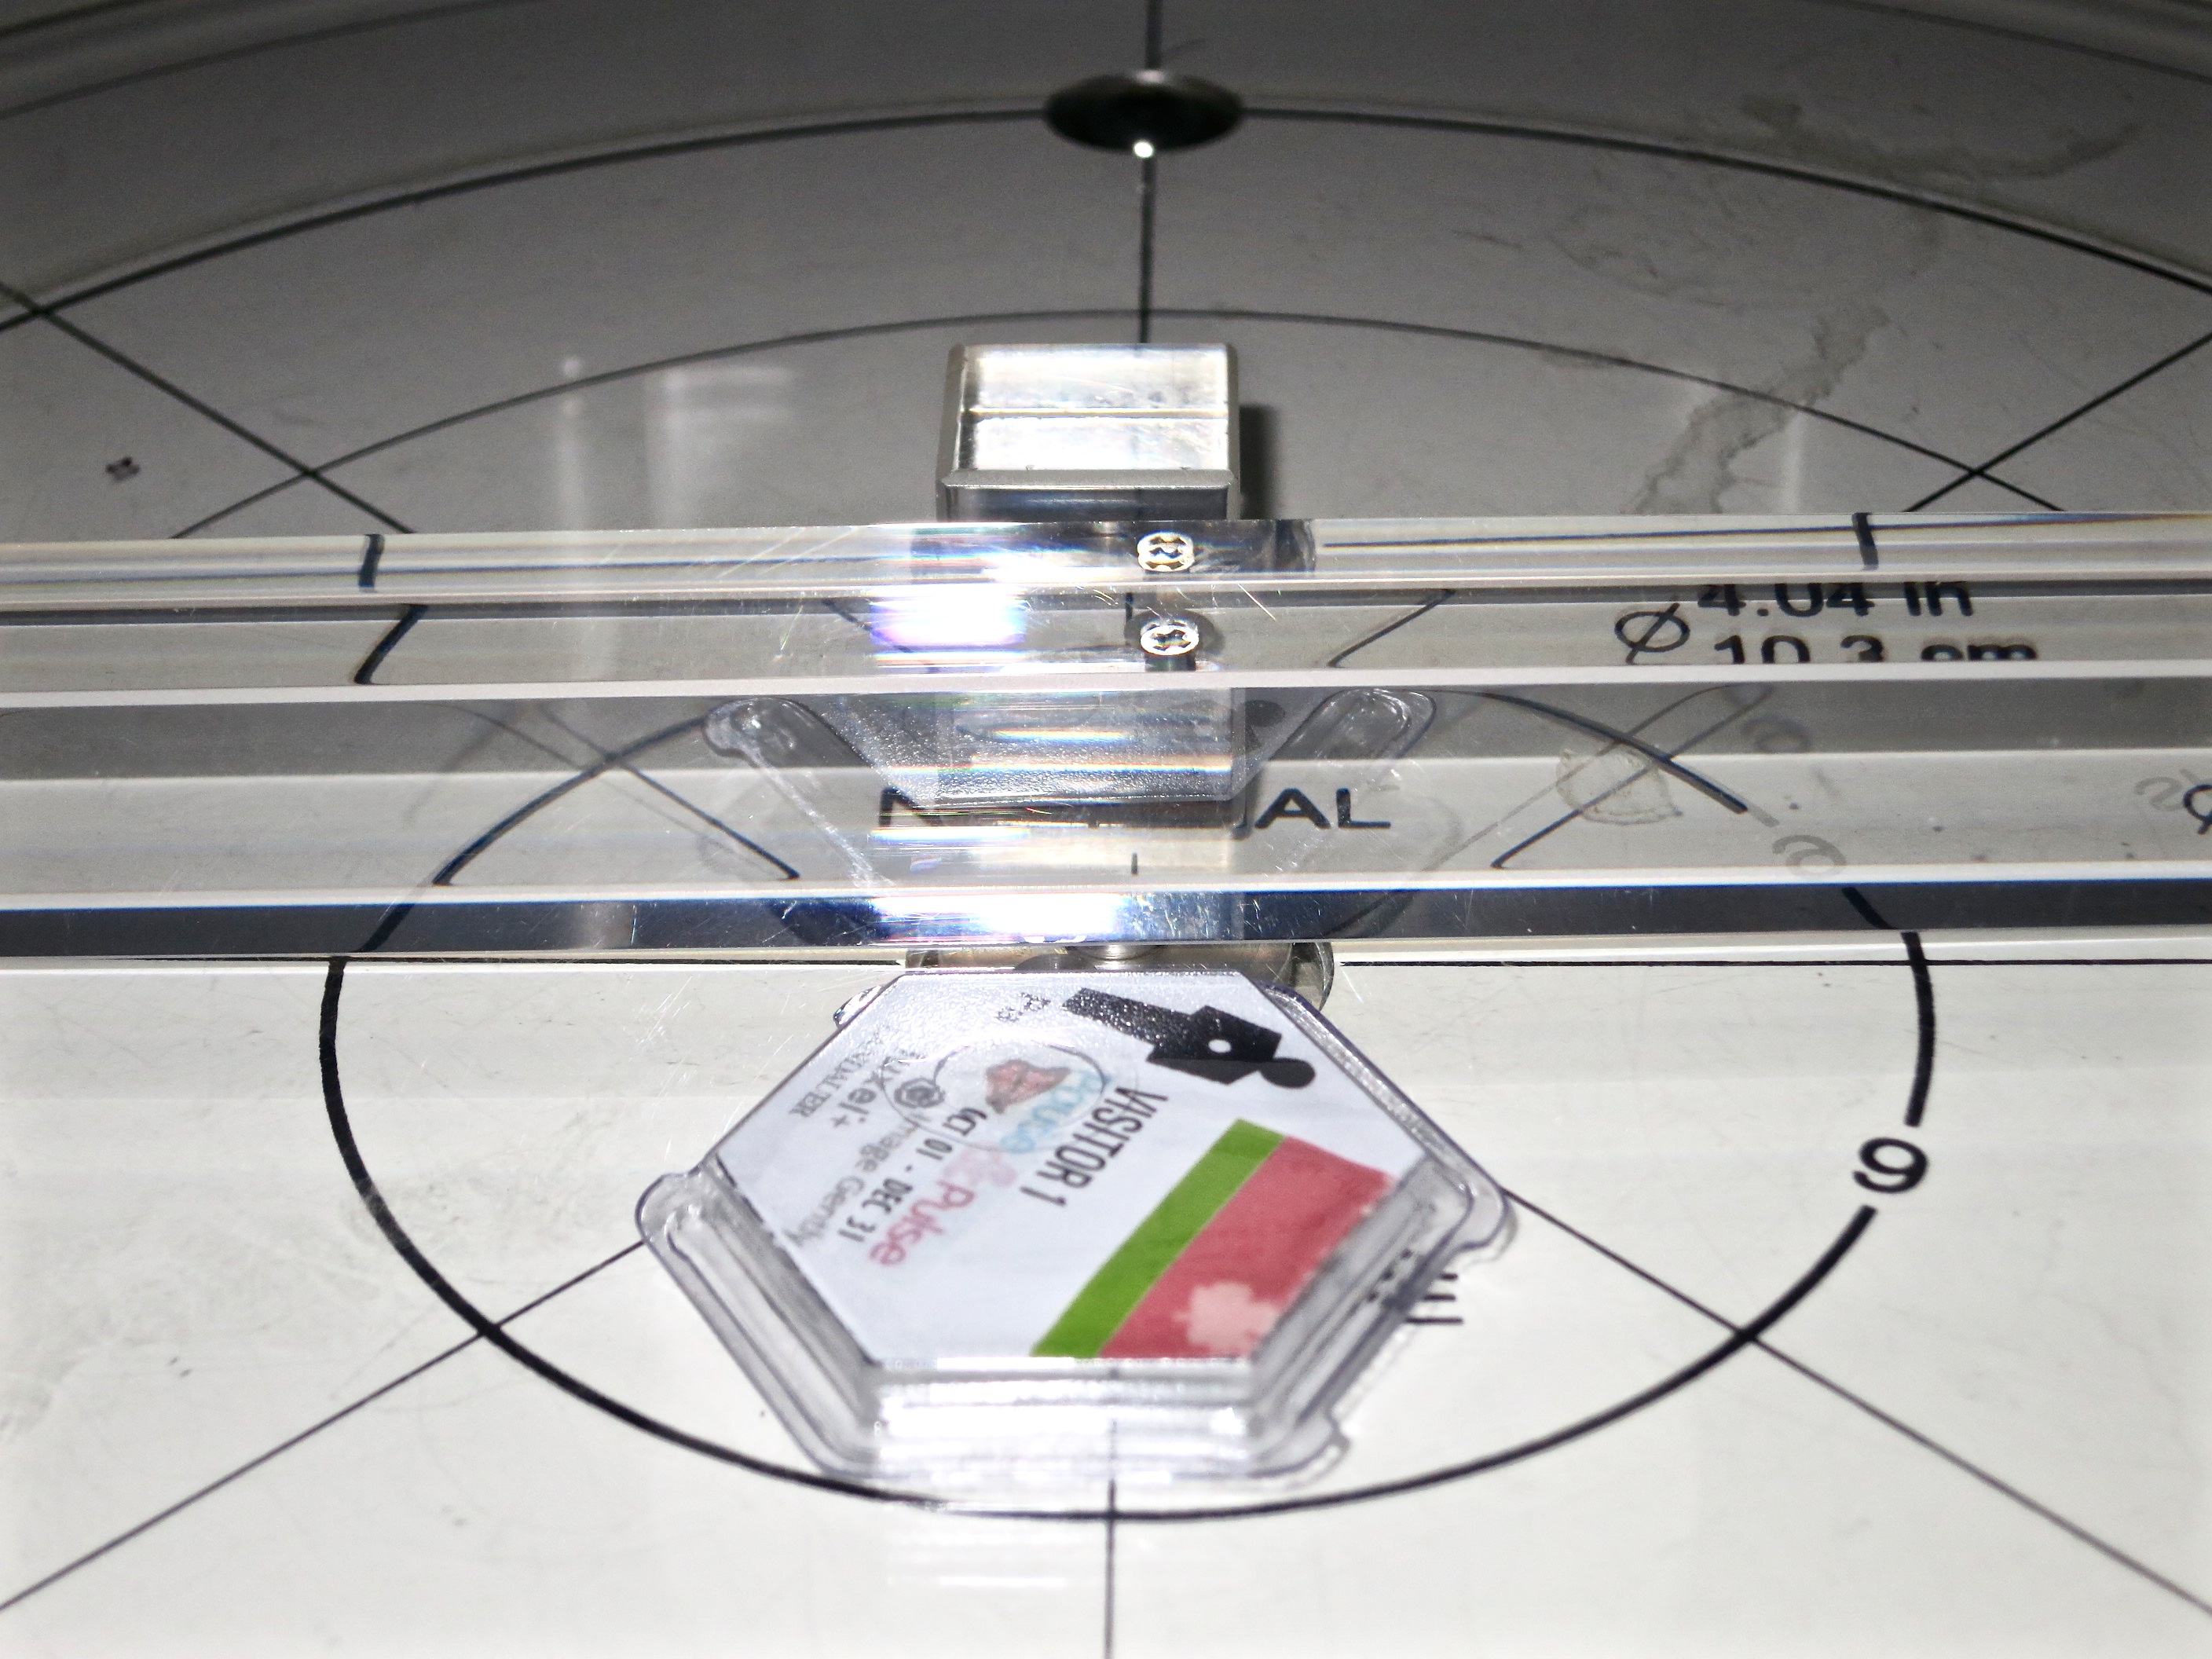
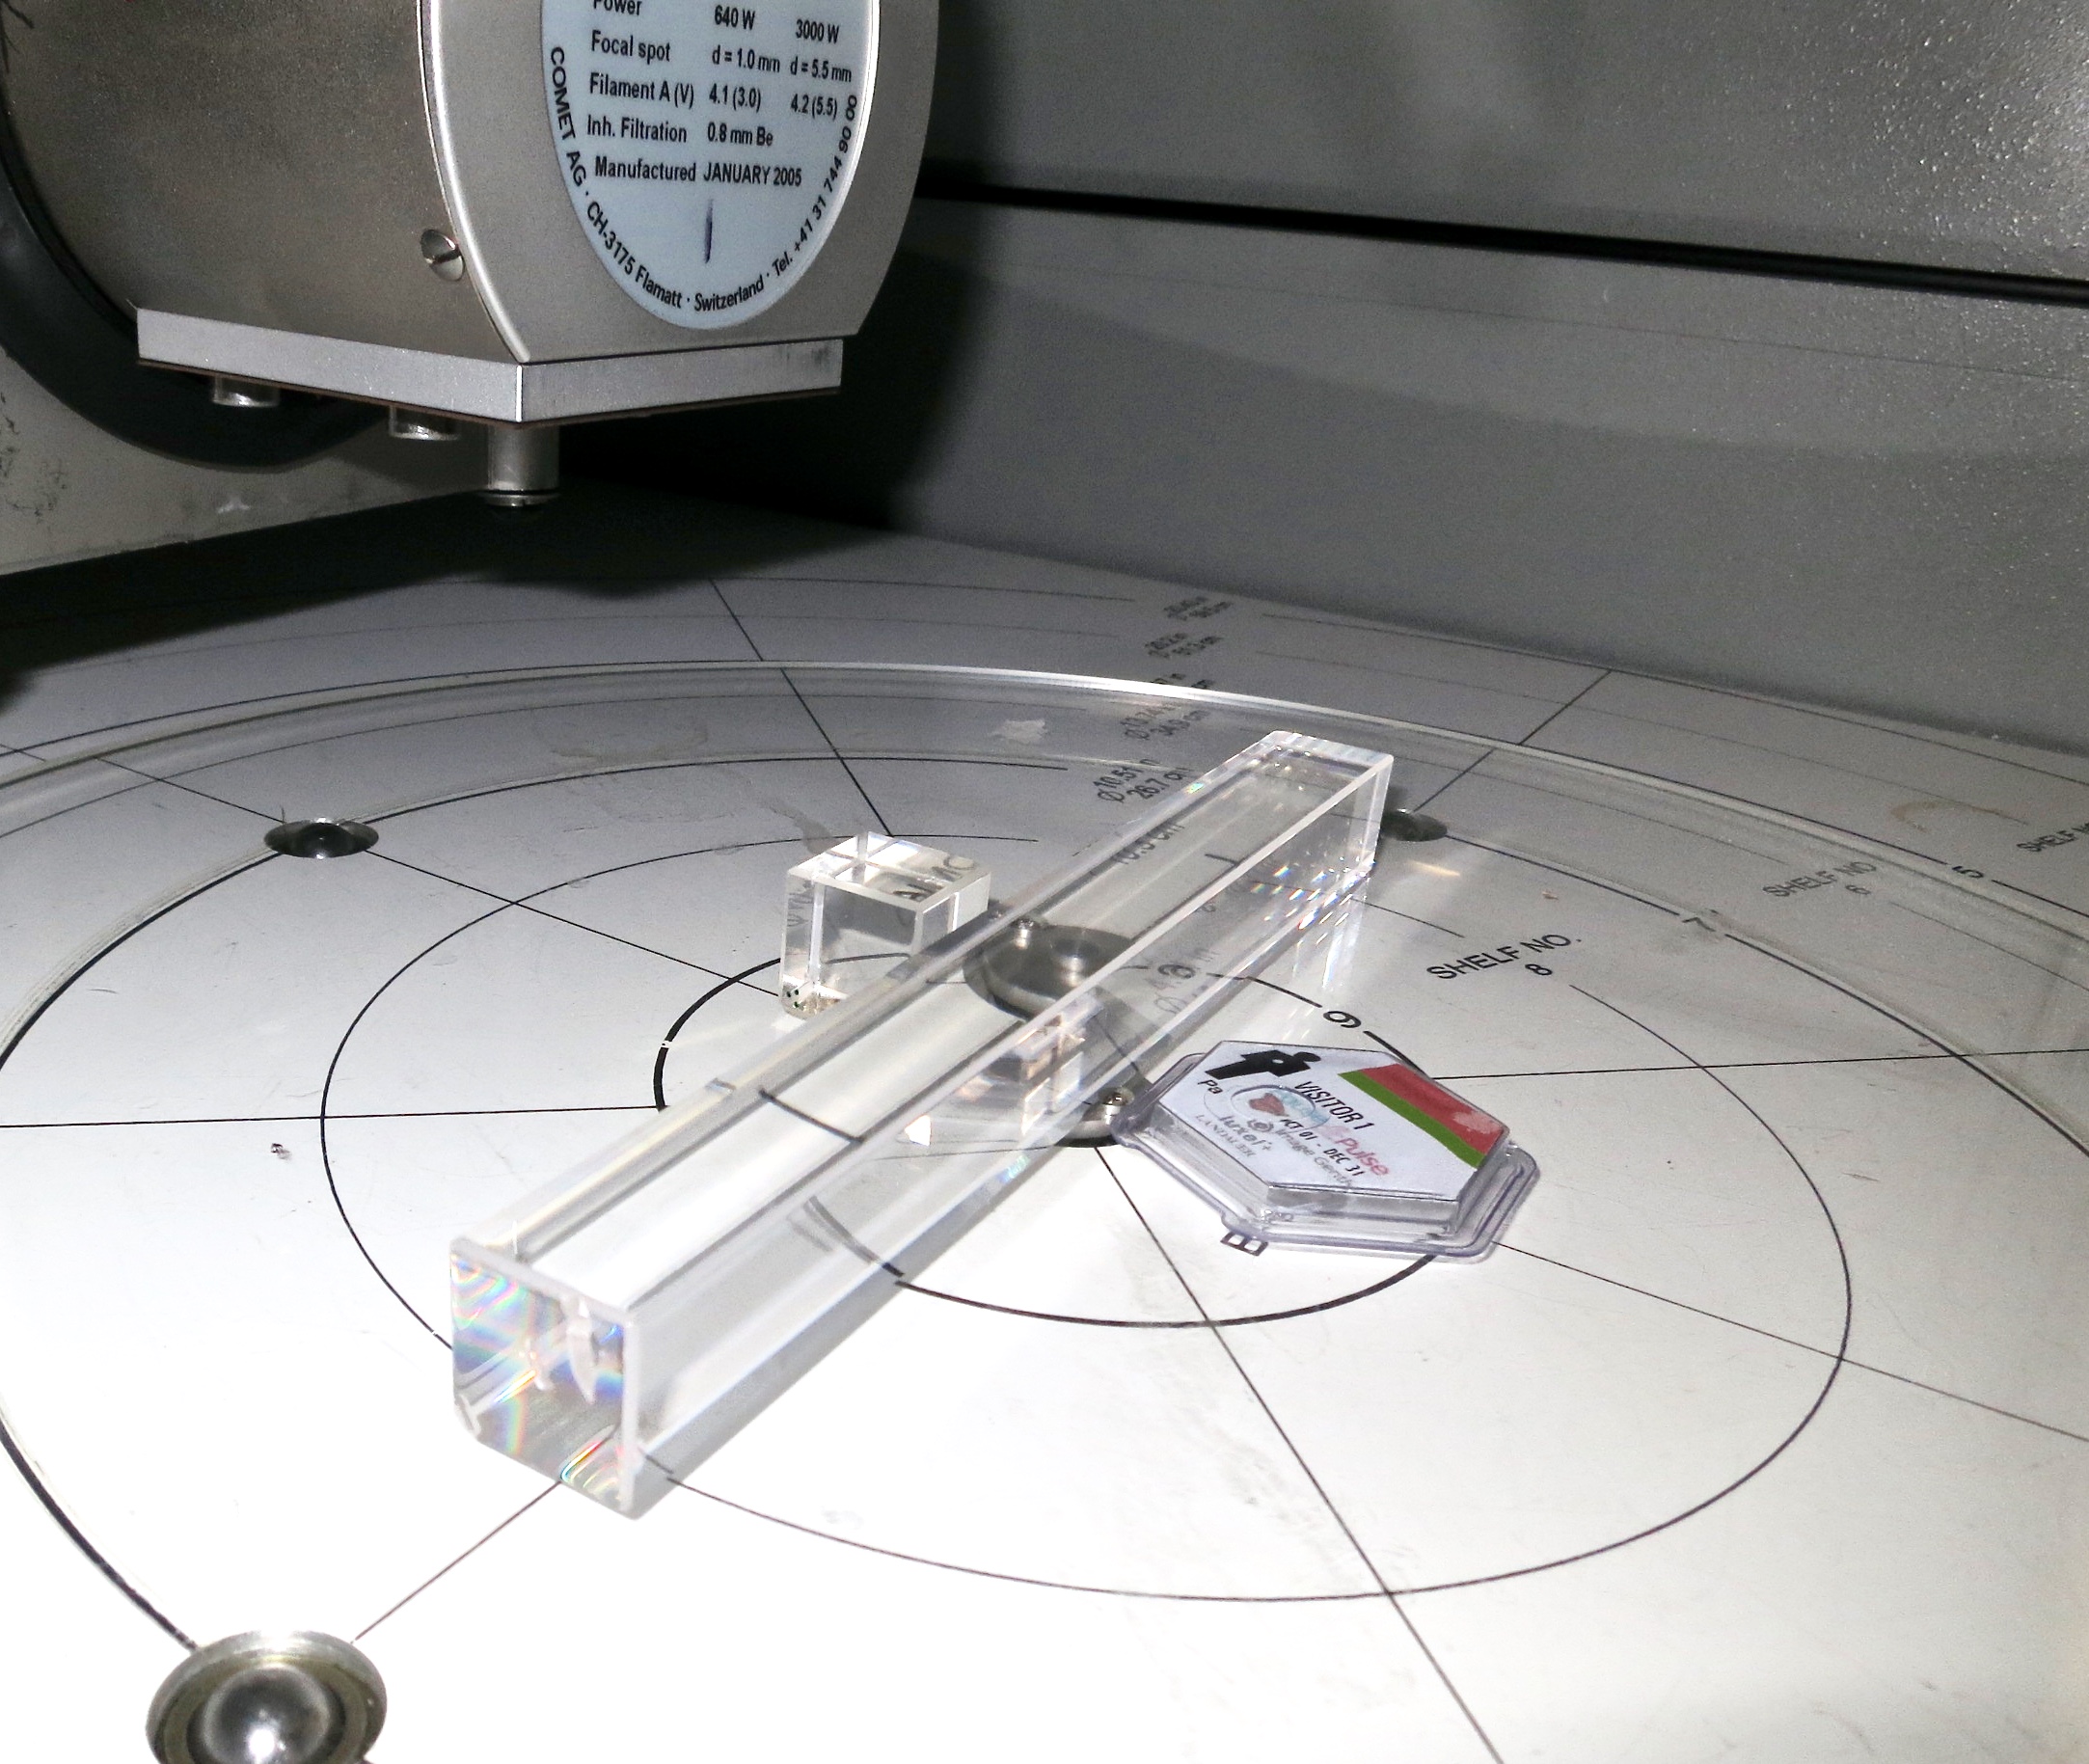
| 21:33, 13 November 2015 | Irrad cube crystal dosimeter close view.jpg (file) |  |
1.28 MB | 1 | |
| 21:32, 13 November 2015 | Irrad cube and crystal dosimeter.jpg (file) |  |
967 KB | 1 | |
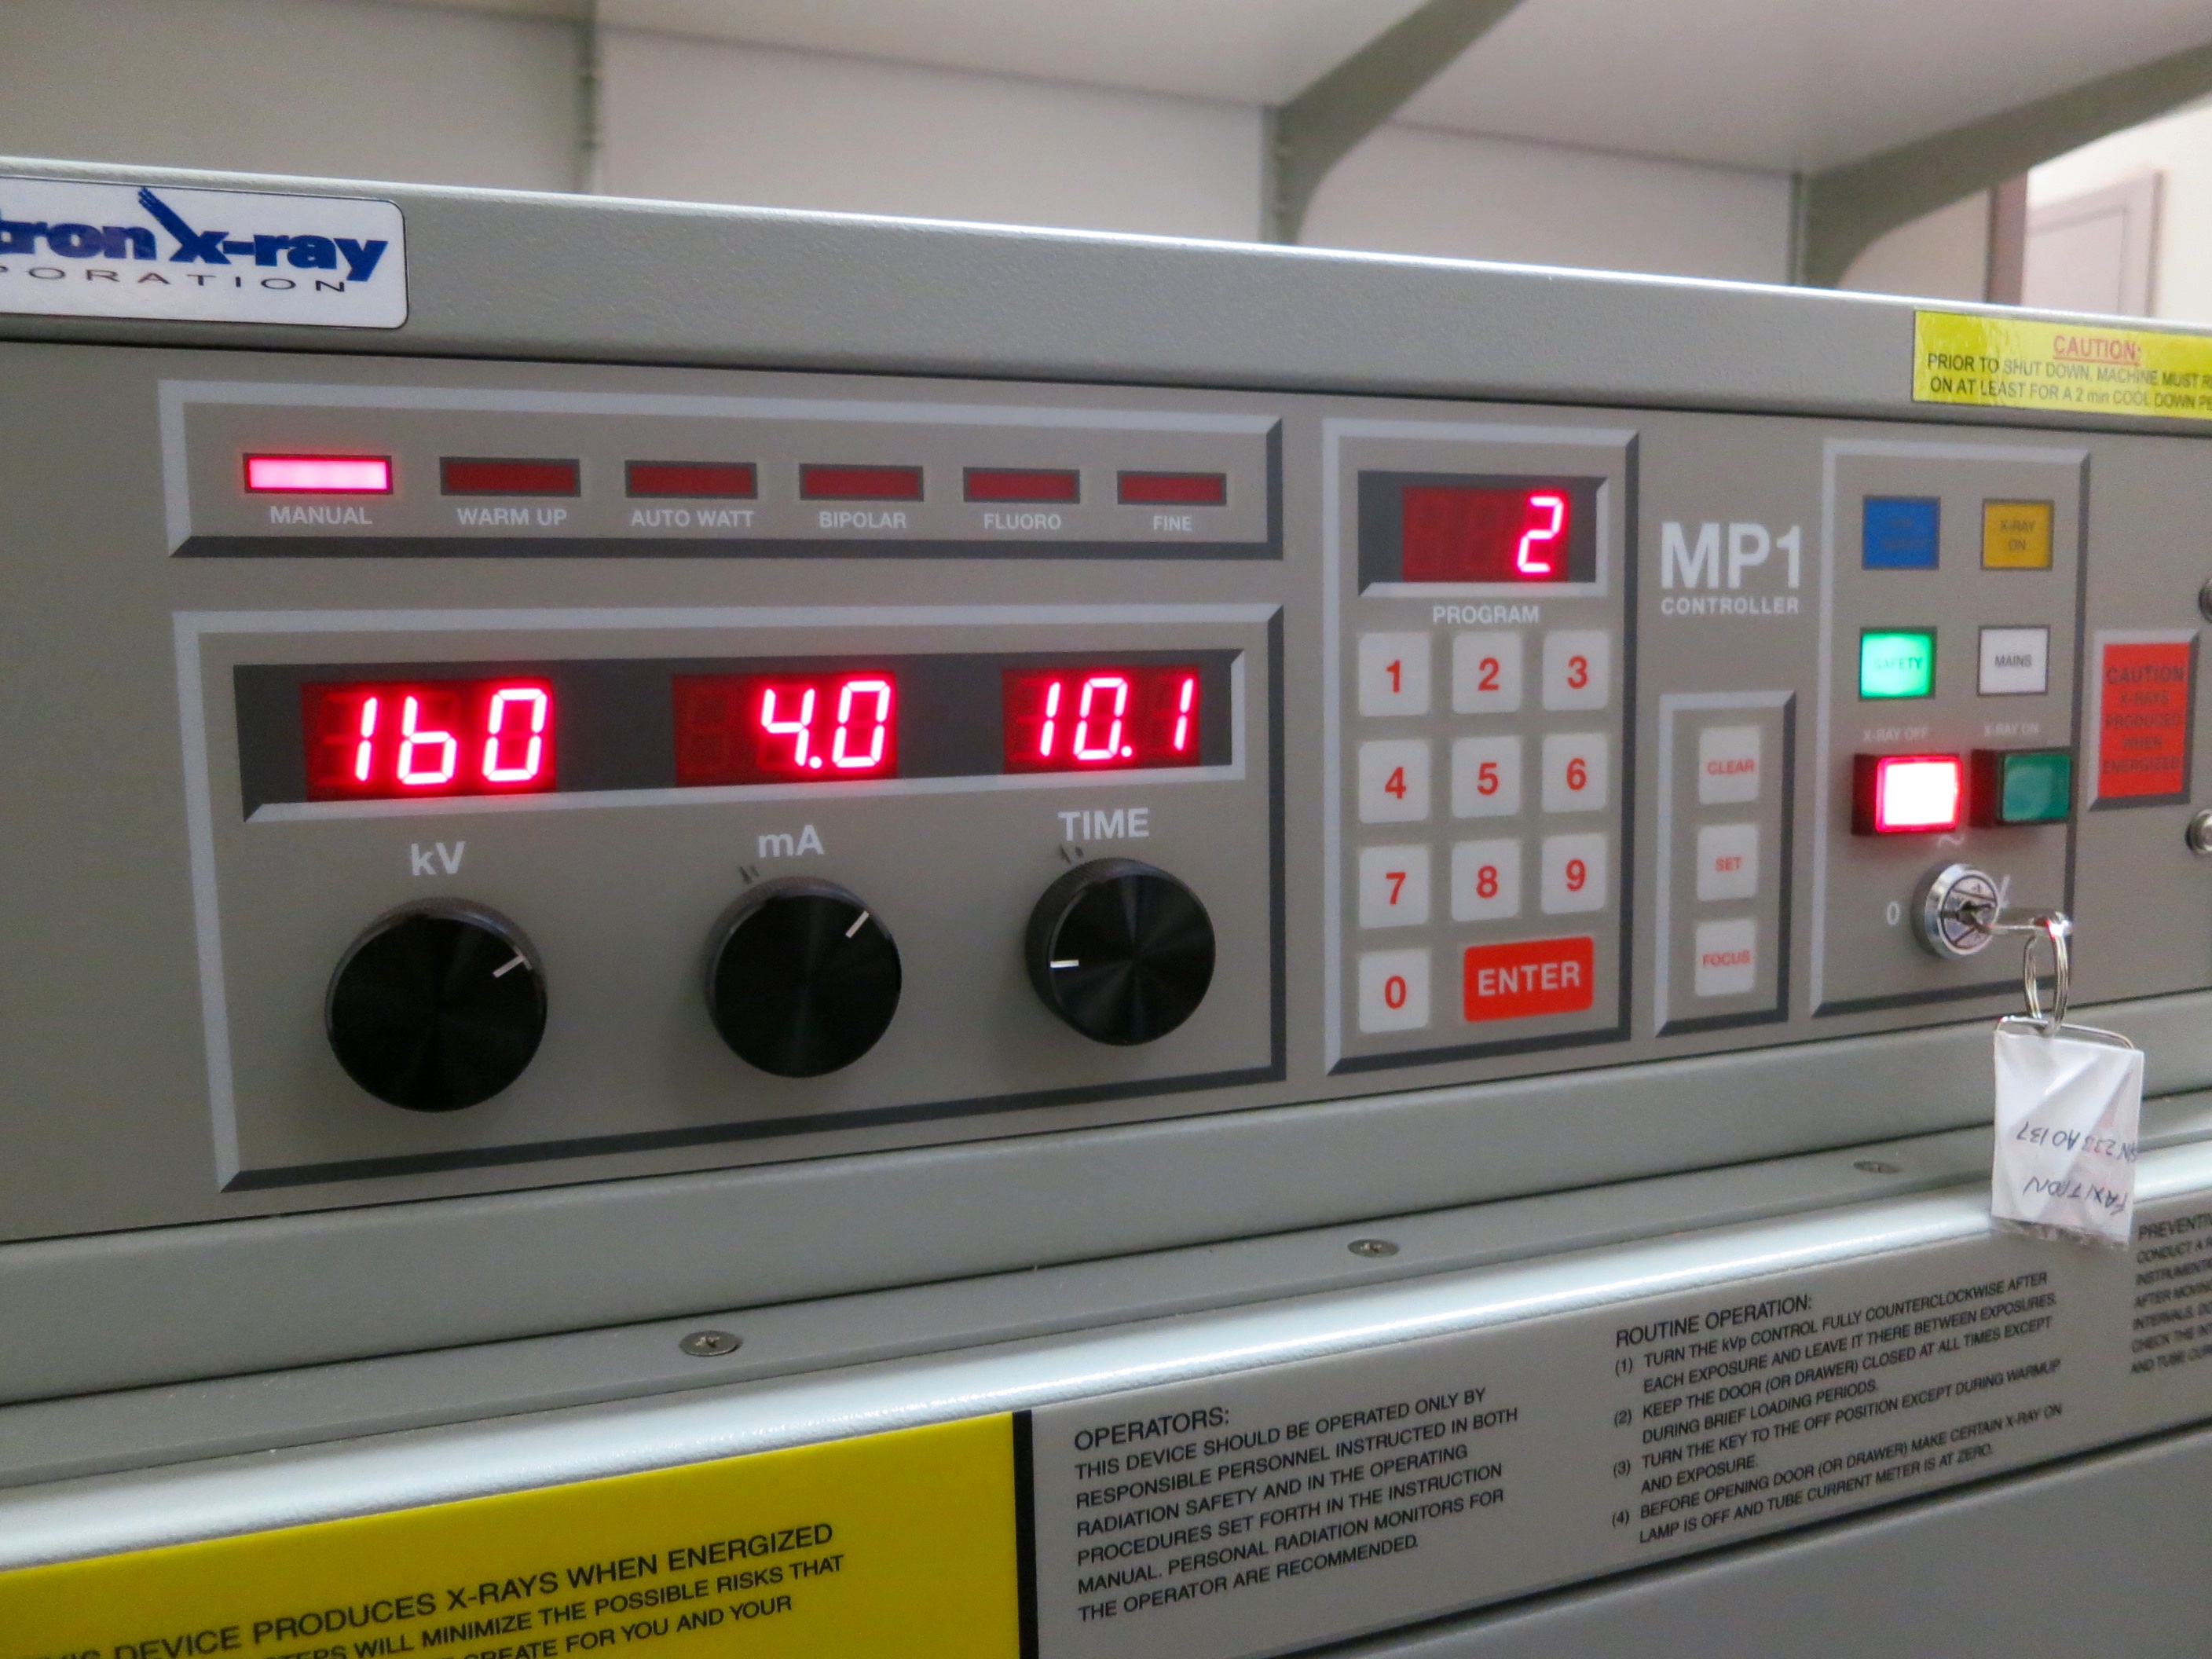
| 21:32, 13 November 2015 | Irrad control 4.jpg (file) |  |
1.29 MB | 1 | |
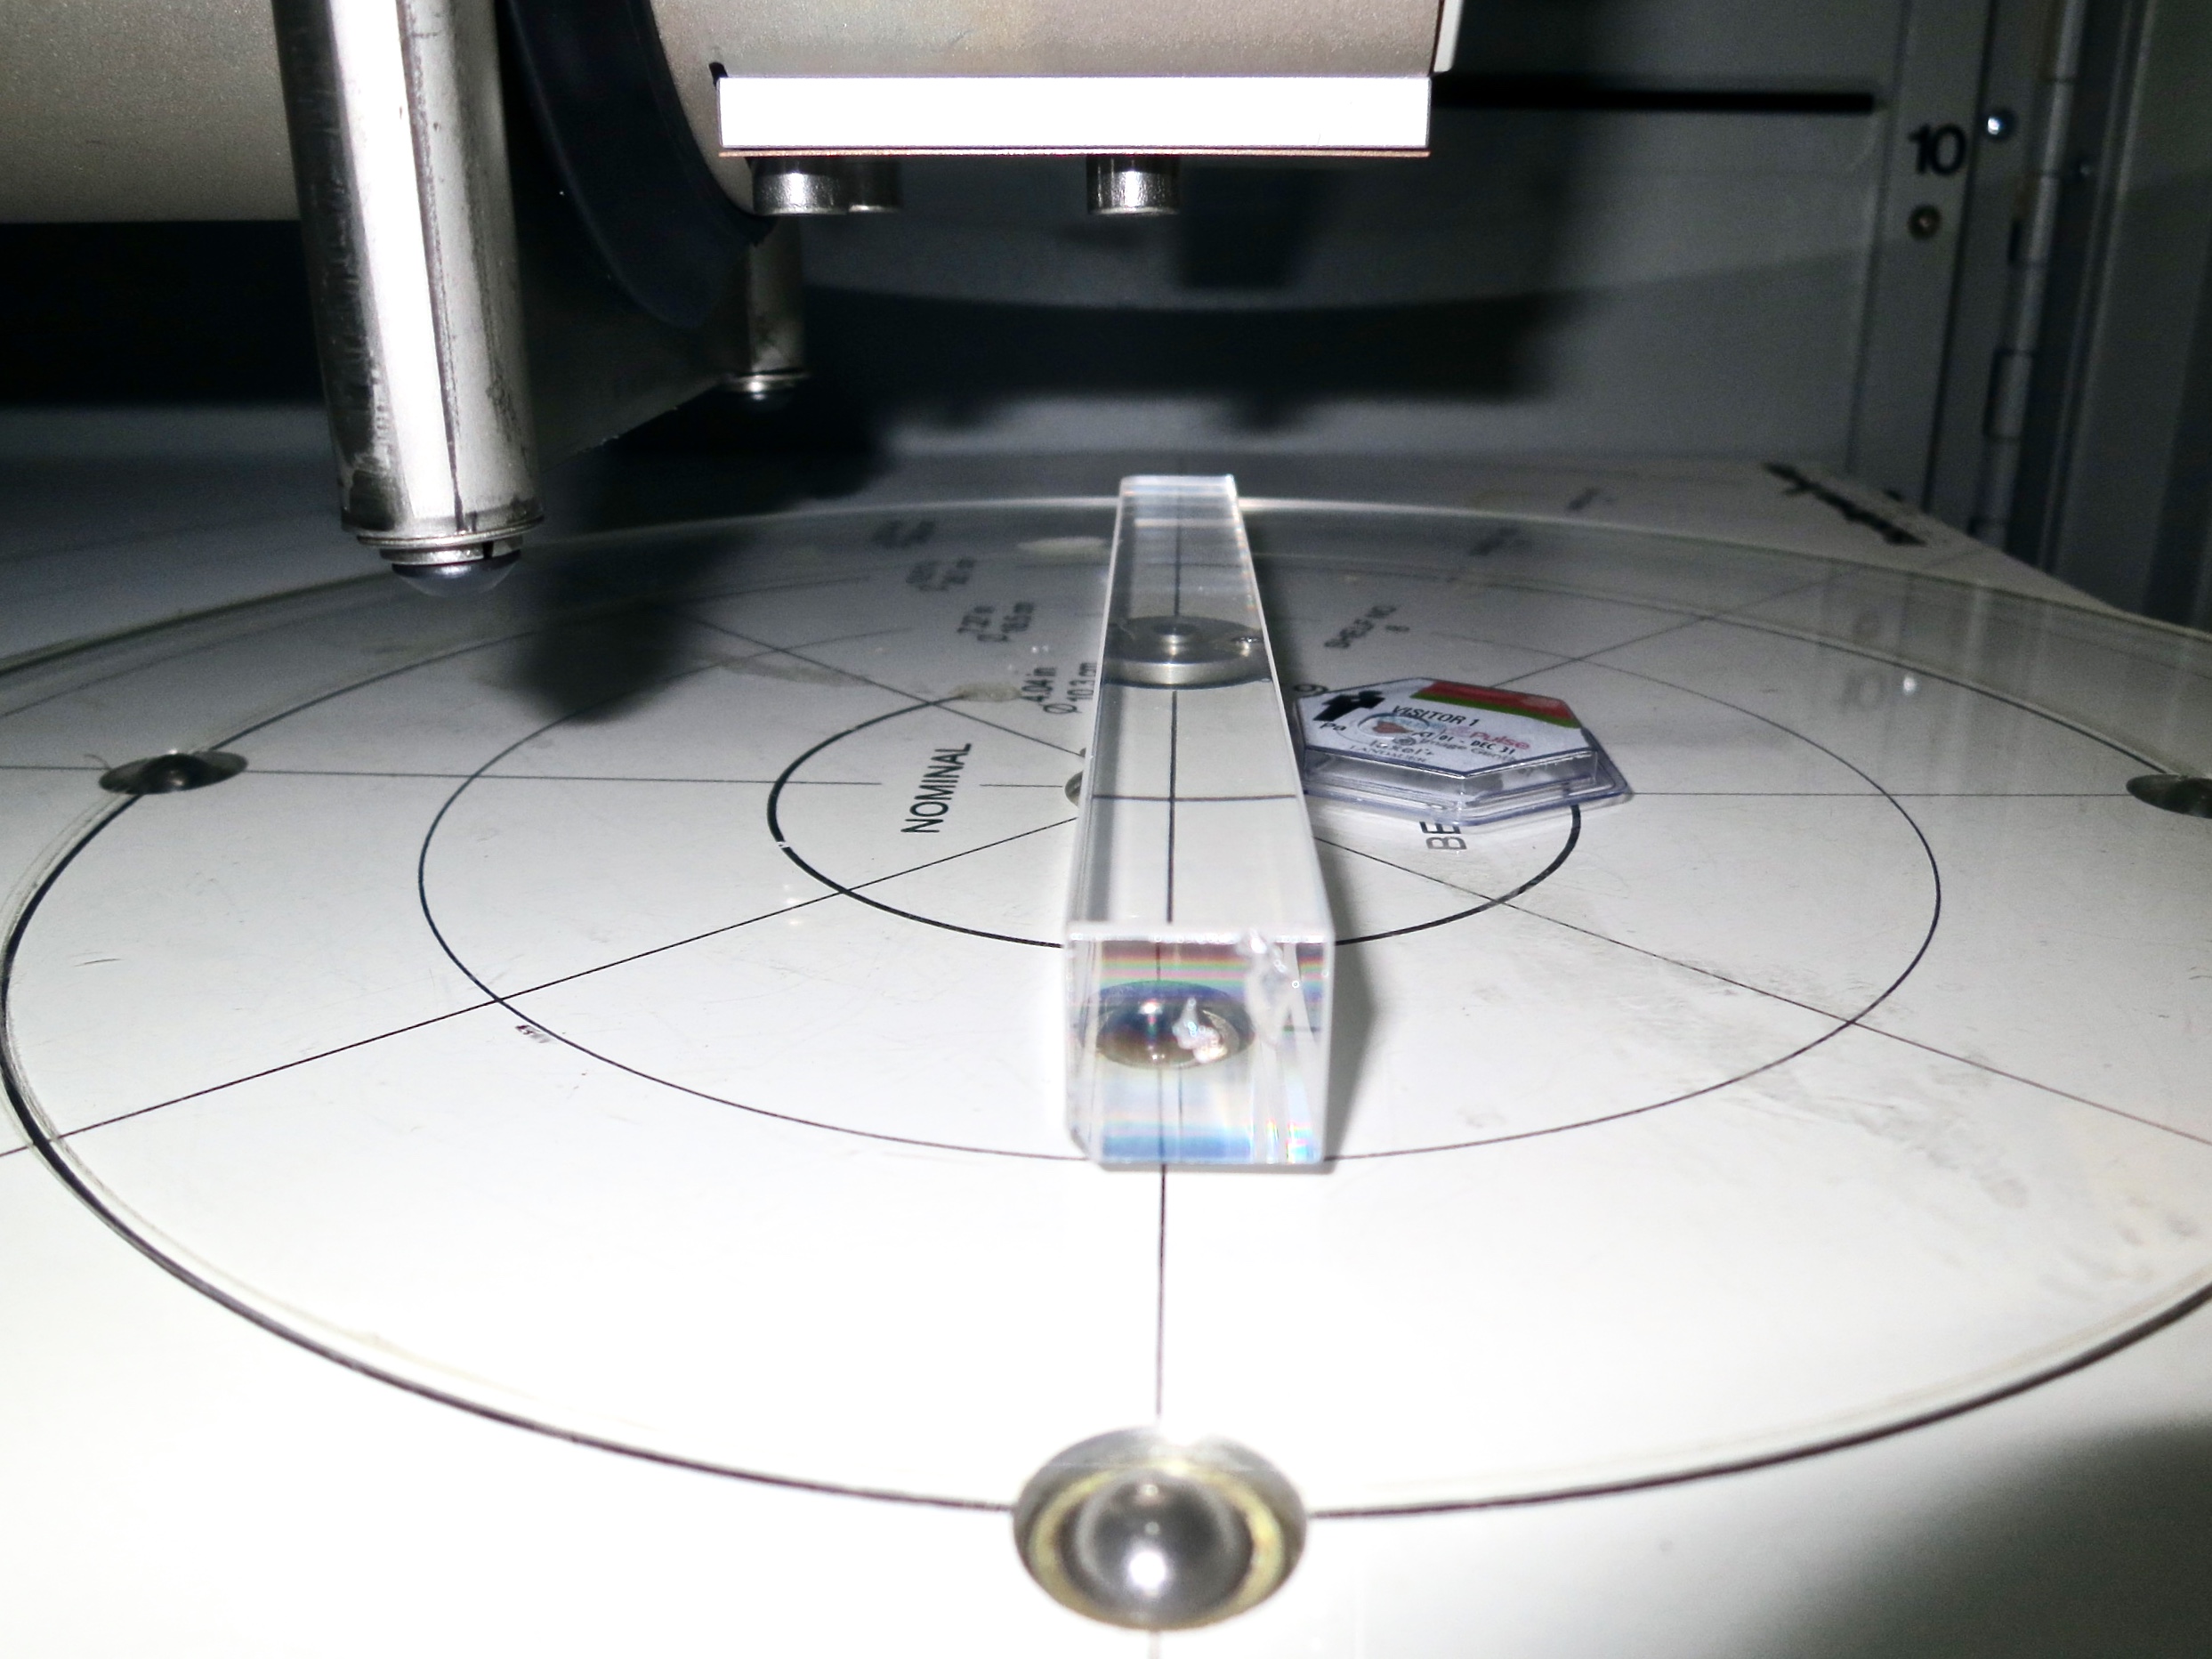
| 21:32, 13 November 2015 | Irrad side view 3.jpg (file) |  |
820 KB | 1 | |
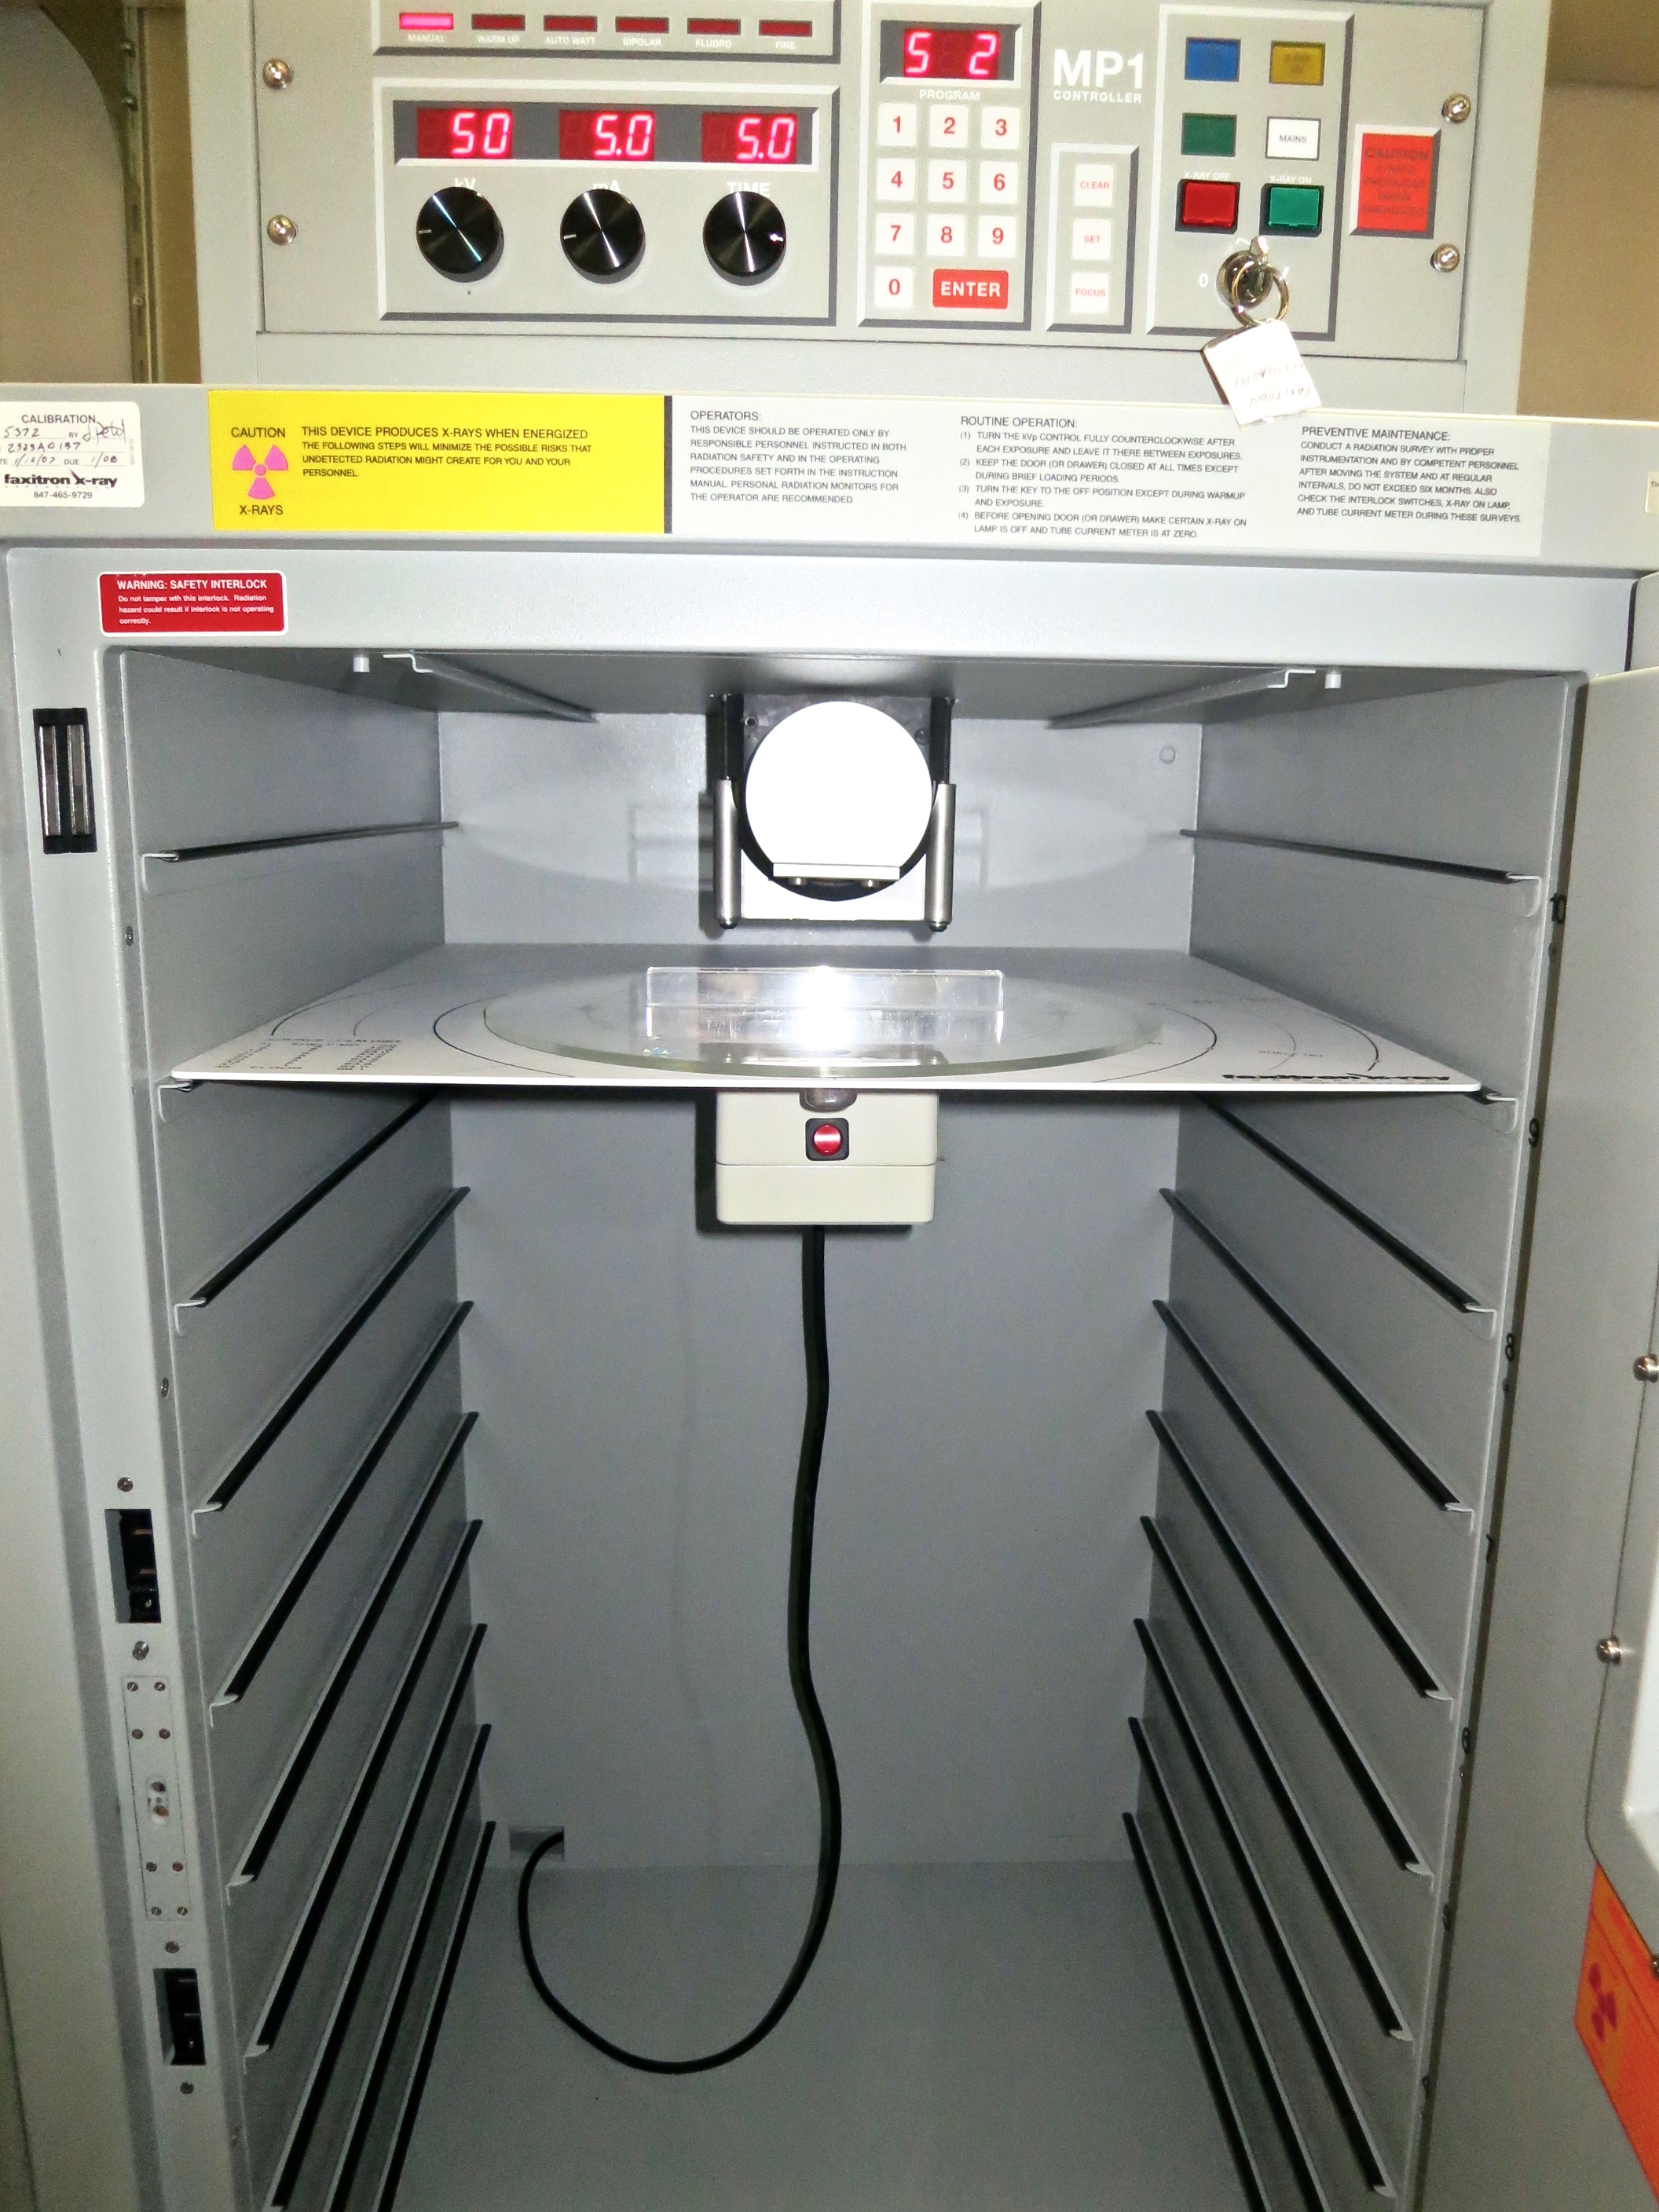
| 21:31, 13 November 2015 | Irrad full view 2.jpg (file) |  |
1.5 MB | 1 | |
| 21:31, 13 November 2015 | Irradiation front close view 1.jpg (file) |  |
1.36 MB | 1 | |
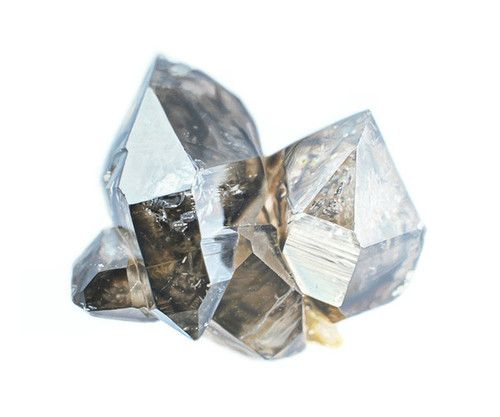
| 17:36, 13 November 2015 | Crystal pretty.jpg (file) |  |
20 KB | 1 | |
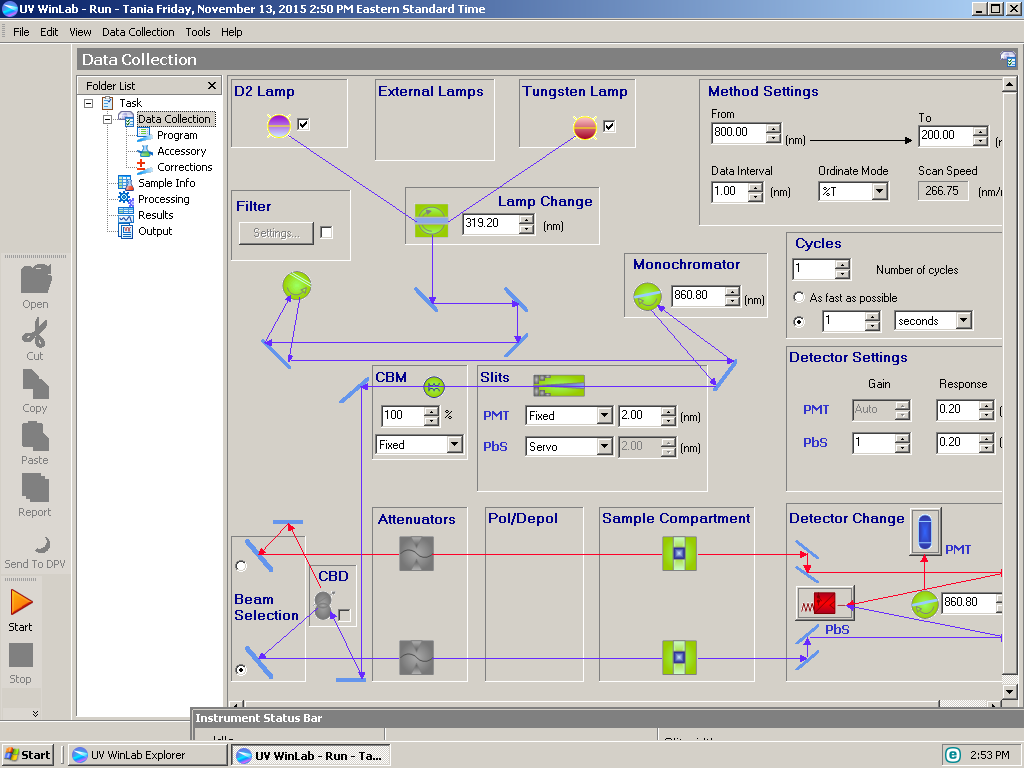
| 16:58, 13 November 2015 | Slit width config pic.png (file) |  |
76 KB | A screen shot of the configuration panel for changing the spectrometer slit width in front of the PMT. The nominal slit width is 2.00 nm, as shown on the configuration panel. | 1 |
| 16:02, 12 November 2015 | DIFF pbf2 shifted to check for uniformity.png (file) |  |
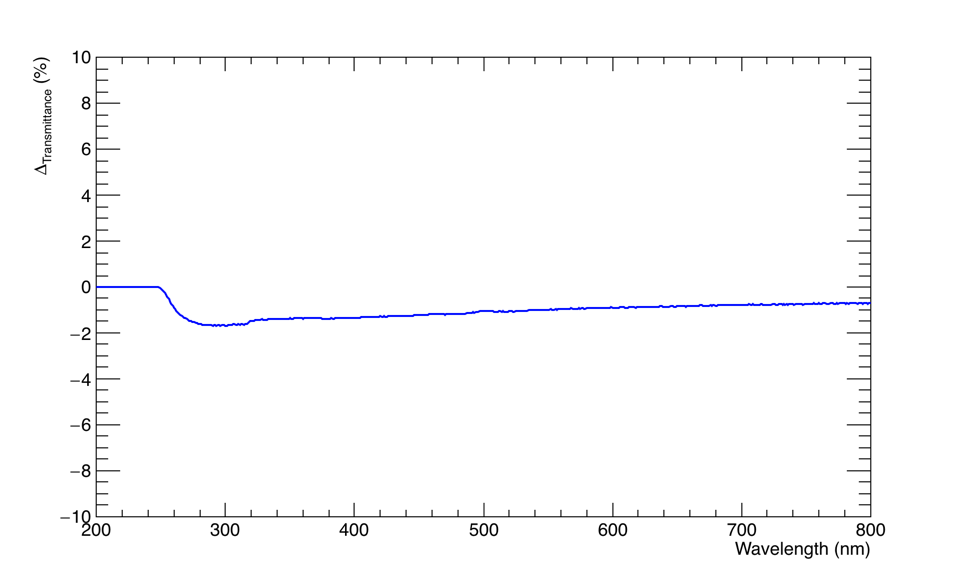
33 KB | Graph showing difference of Transmittance (%) vs. Wavelength (nm) measurements of PbF2 Cube centered at the compartment and shifted at the center of the compartment. | 1 |
| 15:20, 12 November 2015 | Pbf2 center and shifted tocheckforuniformity.png (file) |  |
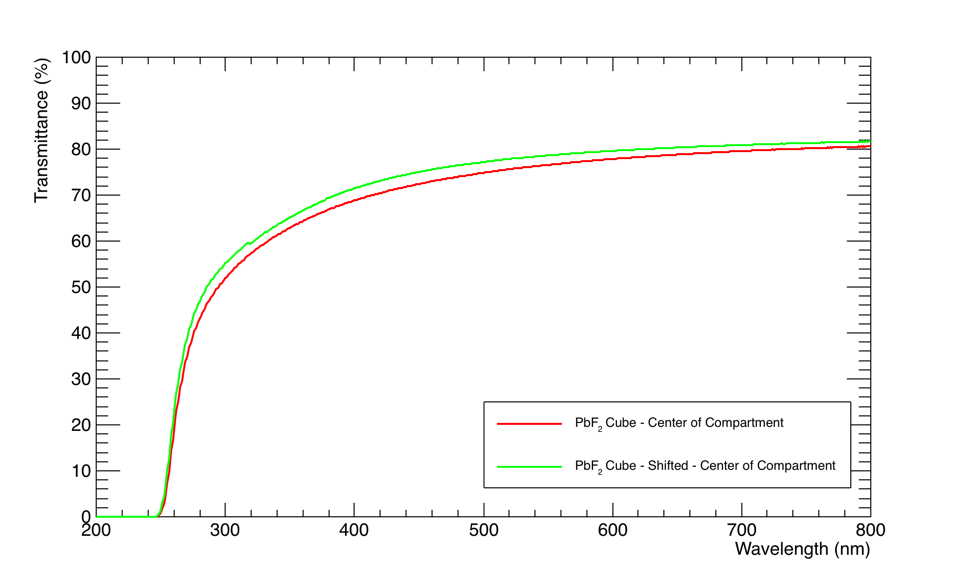
53 KB | Graph showing measurements of Transmittance (%) vs. Wavelength (nm) of PbF2 crystal cube oriented at the center of the compartment (red) and the the crystal shifted at the center of the compartment (green) in order to demonstrate the uniformity of the cub | 1 |
| 13:32, 12 November 2015 | Corrected pbf2 cube 4 positions alongbeam.png (file) |  |
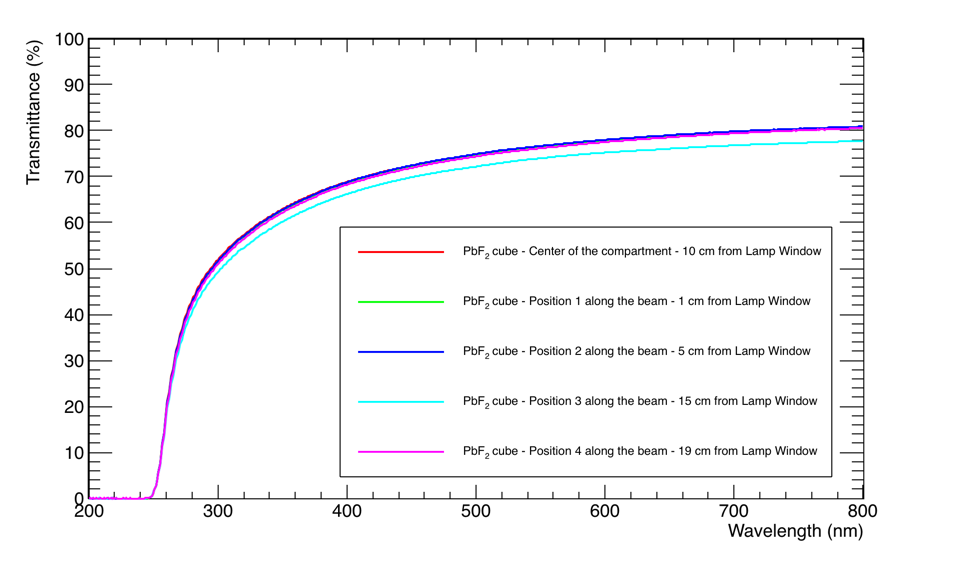
78 KB | Graph showing measurements of Transmittance (%) vs. Wavelength (nm) of PbF2 crystal cube oriented at the center of the compartment and beam or 10 cm away from the lamp window (red), 1 cm away from the window oriented along the beam (green), 5 cm away from | 1 |
| 20:20, 11 November 2015 | DIFF pbf2 cube centered.png (file) |  |
36 KB | Graph showing the difference between the two measurements of the PbF2 crystal cube. | 1 |
| 20:19, 11 November 2015 | PbF2 cube.png (file) |  |
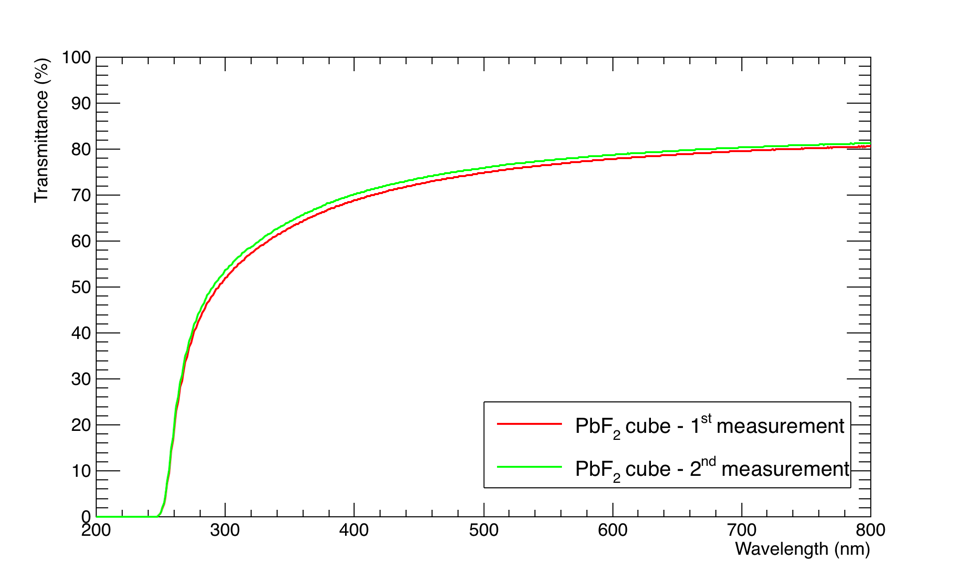
54 KB | Graph showing two measurements of Transmittance (%) vs. Wavelength (nm) of PbF2 cube crystal at different times to check for reproducibility of measurements. | 1 |
| 20:00, 11 November 2015 | DIFFERENCE CRYTUR 10 cm windows and no windows.png (file) |  |
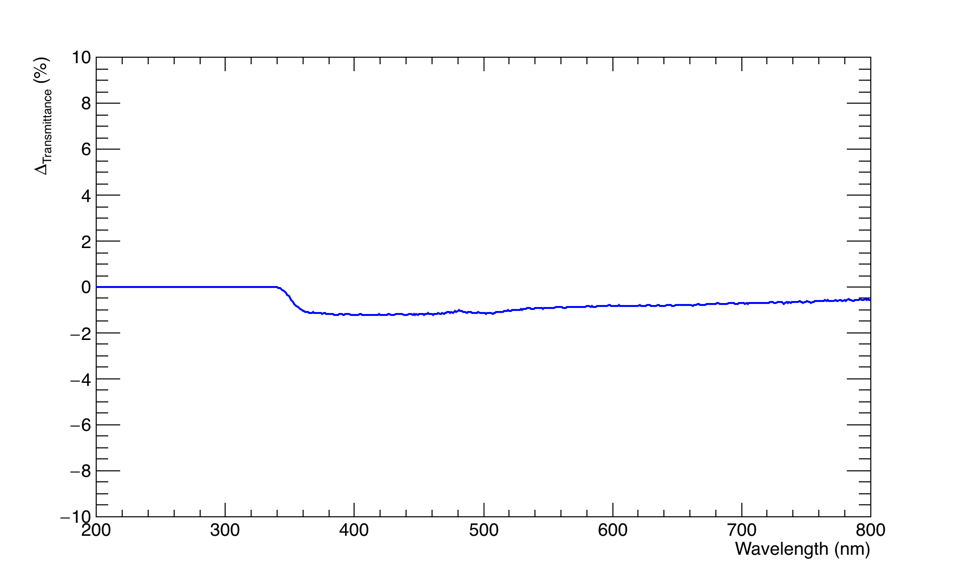
32 KB | Graph showing difference of 10-cm CRYTUR crystal Transmission (%) vs. Wavelength (nm) measurements. | 1 |
| 19:59, 11 November 2015 | CRYUR 10 cm windows and no windows.png (file) |  |
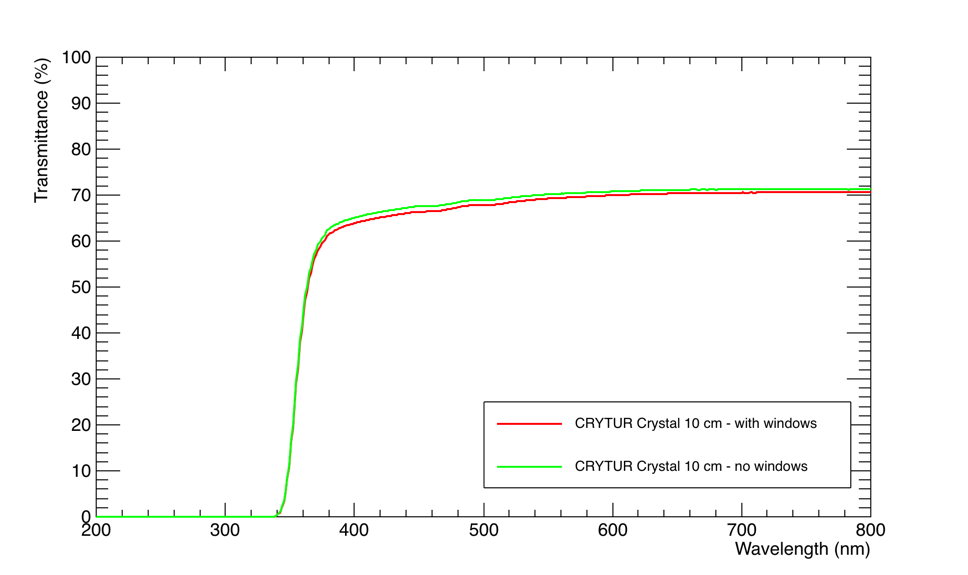
49 KB | Graph showing Transmittance(%) vs. Wavelength(nm) of 10-cm CRYTUR crystal with windows (red) and without windows (green). | 1 |
| 19:40, 11 November 2015 | DIFF BTCP -- with and with cloth.png (file) |  |
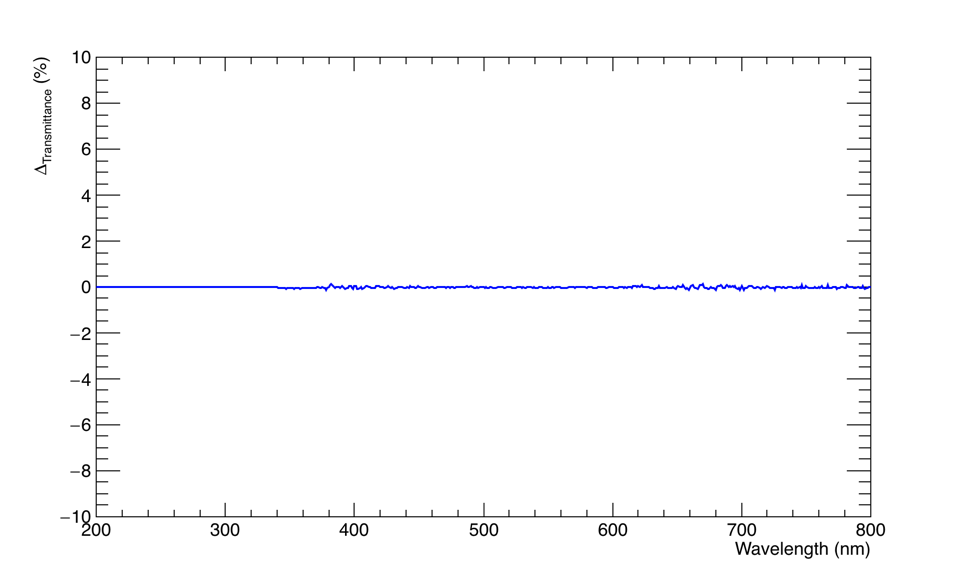
33 KB | Difference of 20-cm BTCP Crystal shown with Sample Compartment Cover and with Dark Cloth. | 1 |
| 19:38, 11 November 2015 | BTCP -- with lid and with cloth.png (file) |  |
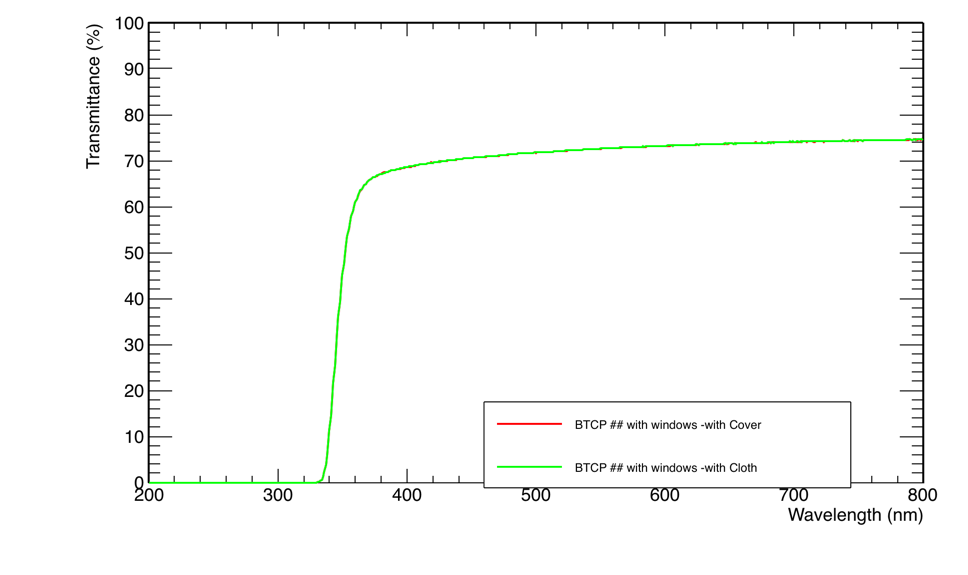
46 KB | BTCP Crystal with Windows- with Dark Cloth (green) and with Sample Compartment Cover (red). | 1 |
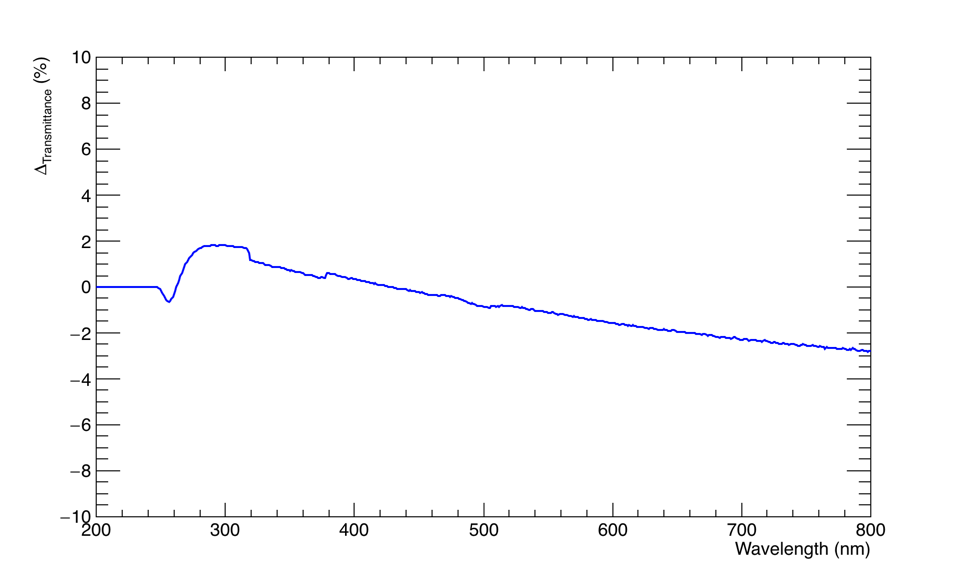
| 19:35, 11 November 2015 | DIFF PBf2 cube no windows and windows centered.png (file) |  |
35 KB | Difference of with and without magnetic windows shown of PbF2 cube. | 1 |
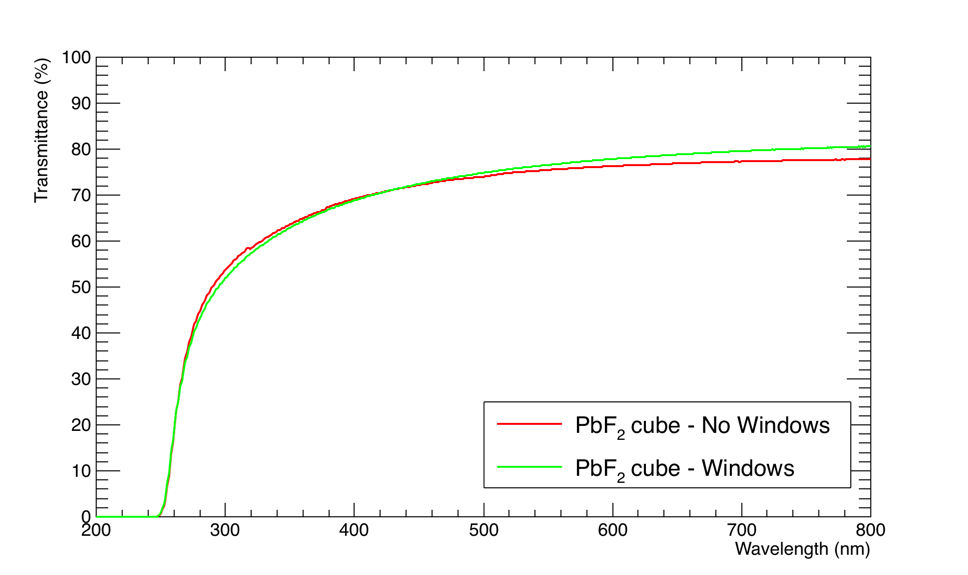
| 19:33, 11 November 2015 | PBf2 cube centered with windows and no windows.png (file) |  |
53 KB | PbF2 Cube centered with windows (green) and without windows (red). | 1 |
| 19:28, 11 November 2015 | DIFF CRYTUR 10 cm at 2 nm and 4 nm slit widths.png (file) |  |
37 KB | Difference of graphs shown of CRYTUR 10-cm Crystal at 2.00 nm and 4.00 nm | 1 |
| 19:18, 11 November 2015 | CRYTUR 10 cm Crystal at 2.00 nm and 4.00 nm slit widths.png (file) |  |
52 KB | 1 |