Uploads by Andres
Jump to navigation
Jump to search
This special page shows all uploaded files.
| Date | Name | Thumbnail | Size | Description | Versions |
|---|---|---|---|---|---|
| 17:42, 17 November 2017 | ScanTT 5023.png (file) | 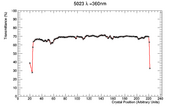 |
17 KB | 1 | |
| 17:42, 17 November 2017 | ScanTT 5021.png (file) | 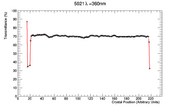 |
16 KB | 1 | |
| 17:41, 17 November 2017 | ScanTT 5022.png (file) | 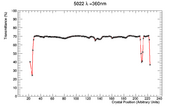 |
17 KB | 1 | |
| 16:46, 17 November 2017 | TT 5030.png (file) | 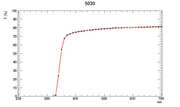 |
11 KB | 1 | |
| 16:46, 17 November 2017 | TT 5028.png (file) | 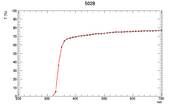 |
11 KB | 1 | |
| 16:46, 17 November 2017 | TT 5027.png (file) | 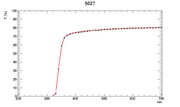 |
11 KB | 1 | |
| 16:45, 17 November 2017 | TT 5026.png (file) | 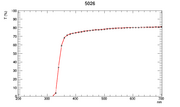 |
11 KB | 1 | |
| 16:44, 17 November 2017 | TT 5025.png (file) | 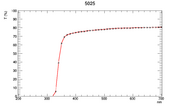 |
11 KB | 1 | |
| 16:44, 17 November 2017 | TT 5024.png (file) | 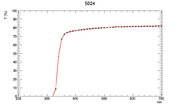 |
11 KB | 1 | |
| 16:44, 17 November 2017 | TT 5023.png (file) | 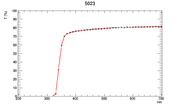 |
11 KB | 1 | |
| 16:43, 17 November 2017 | TT 5022.png (file) | 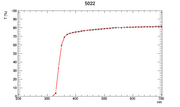 |
11 KB | Transverse Transmittance 5022 | 1 |
| 13:26, 8 October 2017 | XyNpeProjNpe 929.png (file) | 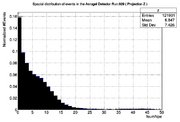 |
17 KB | 1 | |
| 13:26, 8 October 2017 | XyNpeProjNpe 488.png (file) | 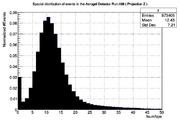 |
18 KB | 1 | |
| 13:25, 8 October 2017 | XyNpeProjNpe 464.png (file) | 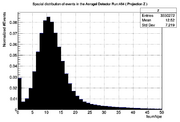 |
17 KB | Distribution of events per Number of photoelectrons generated. | 1 |
| 13:19, 8 October 2017 | XyNpeProjNpe r929.png (file) | 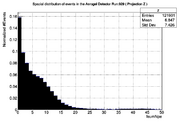 |
17 KB | Distribution of events per Number of photoelectrons generated. | 1 |
| 13:19, 8 October 2017 | XyNpeProjNpe r488.png (file) | 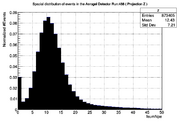 |
18 KB | Distribution of events per Number of photoelectrons generated. | 1 |
| 13:18, 8 October 2017 | XyNpeProjNpe r464.png (file) | 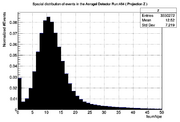 |
17 KB | Distribution of events per Number of photoelectrons generated. | 1 |
| 11:37, 26 September 2017 | HShPreSh r929.png (file) |  |
14 KB | Shower vs Preshower Energy. Refer to https://www.jlab.org/conferences/ugm/talks/tuesday/pooser.pdf slide 16 for more info) Not enough energy to generate signal in the Aerogel | 1 |
| 11:36, 26 September 2017 | HShPreSh r488.png (file) | 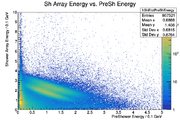 |
57 KB | Shower vs Preshower Energy. Refer to https://www.jlab.org/conferences/ugm/talks/tuesday/pooser.pdf slide 16 for more info) | 1 |
| 11:36, 26 September 2017 | HShPreSh r464.png (file) | 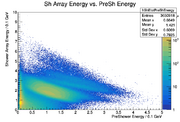 |
52 KB | Shower vs Preshower Energy. Refer to https://www.jlab.org/conferences/ugm/talks/tuesday/pooser.pdf slide 16 for more info | 1 |
| 11:30, 26 September 2017 | GxyNpe r929.png (file) | 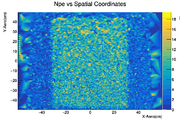 |
203 KB | Number of photoelectrons as a funtion of X,Y Coordinates | 1 |
| 11:30, 26 September 2017 | GxyNpe r464.png (file) | 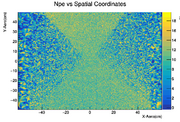 |
345 KB | Number of photoelectrons as a function of X,Y coordinates | 1 |
| 11:27, 26 September 2017 | GxyNpe r488.png (file) | 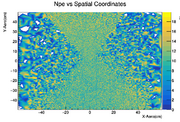 |
294 KB | Number of Photoelectrons in the aerogel detector as a function of X,Y coordinates | 1 |
| 11:24, 26 September 2017 | SpacialAerogelDistribution r929.png (file) | 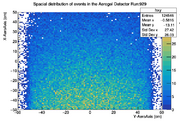 |
40 KB | Fixing coordinates | 3 |
| 11:23, 26 September 2017 | SpacialAerogelDistribution r488.png (file) | 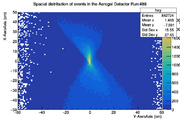 |
21 KB | Fixing coordinates | 3 |
| 11:23, 26 September 2017 | SpacialAerogelDistribution r464.png (file) | 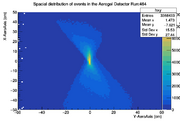 |
19 KB | Fixing coordinates | 6 |
| 15:27, 17 August 2017 | XyNpe r929.png (file) | 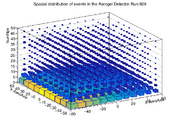 |
49 KB | 3D histogram x/y/npe | 1 |
| 15:27, 17 August 2017 | XyNpe r488.png (file) | 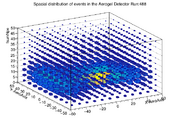 |
49 KB | 3D histogram x/y/npe | 1 |
| 15:26, 17 August 2017 | XyNpe r464.png (file) | 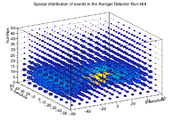 |
48 KB | 3D histogram - X/Y/Npe | 1 |
| 15:24, 17 August 2017 | SignalVsY r929 COL.png (file) | 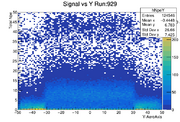 |
21 KB | Color Pallete added | 2 |
| 15:23, 17 August 2017 | SignalVsY r488 COL.png (file) | 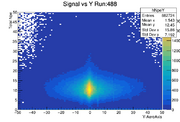 |
18 KB | Color palette added | 2 |
| 15:22, 17 August 2017 | SignalVsY r464 COL.png (file) | 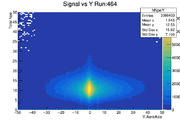 |
17 KB | Color Palette Added | 2 |
| 20:23, 14 August 2017 | SignalVsY r464.png (file) | 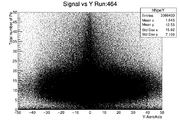 |
53 KB | ((((P.aero.npeSum) vs (P.tr.y[0] + P.tr.ph[0]*ZAERO) Notes: * Single track event cut ))) | 1 |
| 20:15, 14 August 2017 | SignalVsY r488.png (file) | 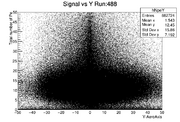 |
52 KB | (((P.aero.npeSum) vs (P.tr.y[0] + P.tr.ph[0]*ZAERO) Notes: * Single track event cut )) | 1 |
| 19:36, 14 August 2017 | SignalVsY r929.png (file) | 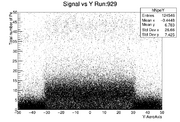 |
44 KB | (P.aero.npeSum) vs (P.tr.y[0] + P.tr.ph[0]*ZAERO) Notes: * Single track event cut | 1 |
| 16:57, 7 June 2017 | SignalSigmaVsTemperature MinRNS.gif (file) | 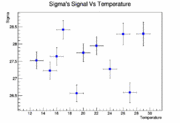 |
7 KB | Signal's Sigma Vs Temperature for Minimum Signal Noise Ratio | 1 |
| 16:56, 7 June 2017 | SignalMeanVsTemperature MinRNS.gif (file) | 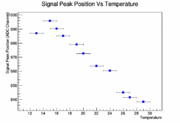 |
8 KB | Signal's Mean Vs Temperature for Minimum Signal Noise Ratio | 1 |
| 16:56, 7 June 2017 | PedestalSigmaVsTemperature MinRNS.gif (file) | 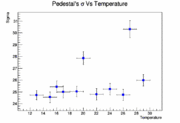 |
7 KB | Pedestal Sigma Vs Temperature for Minimum Signal Noise Ratio | 1 |
| 16:55, 7 June 2017 | PedestalMeanVsTemperature MinRNS.gif (file) | 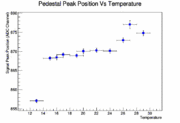 |
8 KB | Pedestal Mean Vs Temperature for Minimum Signal Noise Ratio | 1 |
| 16:38, 6 June 2017 | CoolingBathAPDSetup.JPG (file) | 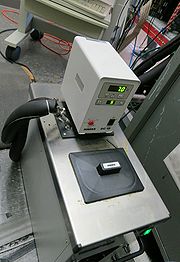 |
957 KB | Cooling Bath [Haake DC10] used to low down the temperature of the APD Setup. | 1 |
| 16:37, 6 June 2017 | GeneralViewAPDSetup.JPG (file) |  |
2.34 MB | View of the APD Setup using the LED Driver Borrowed from JLab | 1 |
| 16:32, 6 June 2017 | MoistureAccumulation2.JPG (file) | 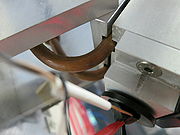 |
1.87 MB | Moisture Accumulation in the APD Setup due to humidity and setting up a low temperature using the cooling bath. | 1 |
| 16:31, 6 June 2017 | MoistureAccumulation1.JPG (file) | 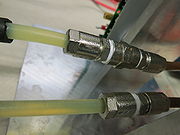 |
1.82 MB | Moisture Accumulation in the APD Setup due to humidity and setting up a low temperature using the cooling bath. | 1 |
| 16:02, 6 June 2017 | 29.00Histo MinRNS.gif (file) | 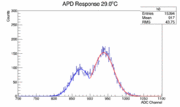 |
13 KB | ADC Spectrum for APD [29°C] Pulse Driver configuration: Delay: 65ns Width: 20ns Vpeak: 1.5 V (HIL: 1.5V - LOL: 0.0V) Rate: 307 Evts/s. LEE/TRE: 4.5ns Gate Width: 205ns Temp Setup: 29°C Temp Cooling Bath: 30°C Lapse between measurements: 30mins | 1 |
| 16:01, 6 June 2017 | 27.00Histo MinRNS.gif (file) | 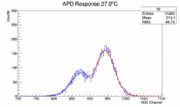 |
13 KB | ADC Spectrum for APD [27°C] Pulse Driver configuration: Delay: 65ns Width: 20ns Vpeak: 1.5 V (HIL: 1.5V - LOL: 0.0V) Rate: 307 Evts/s. LEE/TRE: 4.5ns Gate Width: 205ns Temp Setup: 27°C Temp Cooling Bath: 28°C Lapse between measurements: 30mins | 1 |
| 15:59, 6 June 2017 | 26.00Histo MinRNS.gif (file) | 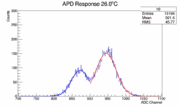 |
13 KB | ADC Spectrum for APD [26°C] Pulse Driver configuration: Delay: 65ns Width: 20ns Vpeak: 1.5 V (HIL: 1.5V - LOL: 0.0V) Rate: 307 Evts/s. LEE/TRE: 4.5ns Gate Width: 205ns Temp Setup: 26°C Temp Cooling Bath: 26°C Lapse between measurements: 30mins | 1 |
| 15:59, 6 June 2017 | 24.00Histo MinRNS.gif (file) | 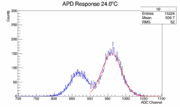 |
13 KB | ADC Spectrum for APD [24°C] Pulse Driver configuration: Delay: 65ns Width: 20ns Vpeak: 1.5 V (HIL: 1.5V - LOL: 0.0V) Rate: 307 Evts/s. LEE/TRE: 4.5ns Gate Width: 205ns Temp Setup: 24°C Temp Cooling Bath: 24°C Lapse between measurements: 30mins | 1 |
| 15:50, 6 June 2017 | 22.00Histo MinRNS.gif (file) | 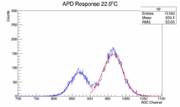 |
13 KB | ADC Spectrum for APD [22°C] Pulse Driver configuration: Delay: 65ns Width: 20ns Vpeak: 1.5 V (HIL: 1.5V - LOL: 0.0V) Rate: 307 Evts/s. LEE/TRE: 4.5ns Gate Width: 205ns Temp Setup: 22°C Temp Cooling Bath: 22°C Lapse between measurements: 30mins | 2 |
| 15:43, 6 June 2017 | 20.00Histo MinRNS.gif (file) | 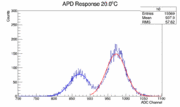 |
13 KB | ADC Spectrum for APD [20°C] Pulse Driver configuration: Delay: 65ns Width: 20ns Vpeak: 1.5 V (HIL: 1.5V - LOL: 0.0V) Rate: 307 Evts/s. LEE/TRE: 4.5ns Gate Width: 205ns Temp Setup: 20°C Temp Cooling Bath: 20°C Lapse between measurements: 30mins | 1 |
| 15:43, 6 June 2017 | 19.00Histo MinRNS.gif (file) | 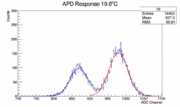 |
13 KB | ADC Spectrum for APD [19°C] Pulse Driver configuration: Delay: 65ns Width: 20ns Vpeak: 1.5 V (HIL: 1.5V - LOL: 0.0V) Rate: 307 Evts/s. LEE/TRE: 4.5ns Gate Width: 205ns Temp Setup: 19°C Temp Cooling Bath: 18°C Lapse between measurements: 30mins | 1 |