MainPage:Nuclear:Summer2012:GainUniformity
| ⇐ Back to Summer 2012 page |
| ⇐ Back to the Main_Page |
As we have the scanning setup ready to make measurements in different points of the PMT, our idea is to flash the LED is a small light intensity in various point to measure the gain in function of the position.
For the analysis, we are going to write a root script to analyse all of the positions automatically. This way it will be possible to make scans of the PMT gain with higher spatial resolution.
Scanning setup
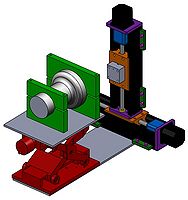
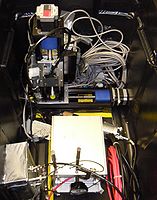
The design and the picture of the scanning setup and can be seen in the following figures.

|

|
The idea of this scanning setup is to flash the blue LED in front of the PMT in different positions. For that, it is necessary to write a code for programming the step motors and upload it into its controller. The written codes for the step motors can found at: COSMOS_Files. It is necessary to run a software to upload it to the controller. This software runs in Windows, so it is not possible to do that with the computer at the lab.
The full range of the scanning is approximately 4.5" x 4.5" (the 5" PMT cannot be completely scanned). The gray piece attached to the step motor is where the LED is placed. There is a small hole (diameter 0.029") in this piece that collimate the light, so that we can define better the position of the incident light. It is also possible to insert paper inside this collimator so that we can reduce the amount of light that goes to the scanned PMT.
An optical fiber was placed in front of the LED and was connected to a reference PMT. It is a 2" PMT placed in the bottom of the box. We can use the signal from this PMT to see it the LED intensity is not changing during the scanning. An example of a result from the scanning can be found in the run #614, in the Coda logbook page 1.
Data acquisition
As the distribution of events between Single Electron Peak (SEP) and Pedestal (PED) is a statistical phenomenon, it is necessary to set the LED intensity to have a good distribution between them. To reduce the 2-electrons peak (that can interfere in the SEP fitting), it is recommended to have a ratio of 1/2 in SEP/PED counts (1/3 of the events in the SEP).
On the other hand of the statistics, the final data file can require a huge disk space. Some suggestions for matrix scanning:
- Matrix 10 x 10 with 30k flashes in each position
- Matrix 100 x 100 with 3k flashes in each position
Script for data analysis
As we want to measure the SEP and the with the LED in several positions, it will be important to write an script that "automatically" identify and fit these peaks in the histogram for each position.
A priori we don't expect great changes in the position of these peaks. So it may be possible to write this script to make an first manual fit with all the data and then use the fitted parameters as initial values for the automatic fit (in each position).
Summarizing, the script will need to:
- Convert the raw data from DAQ/CODA to root. The conversion should prepare the root file for the analyzis: one branch with all data and N branches with the data for each position.
- Fit each branch using the manual fit (over all data) as initial parameters for the data. Perhaps we'll need to add constrains to the peak position, since sometimes the SEP cannot exist (in the case of the LED is not in front of the PMT).