MainPage:Nuclear:Summer2012:Cable
| ⇐ Back to Summer 2012 page |
| ⇐ Back to the Main_Page |


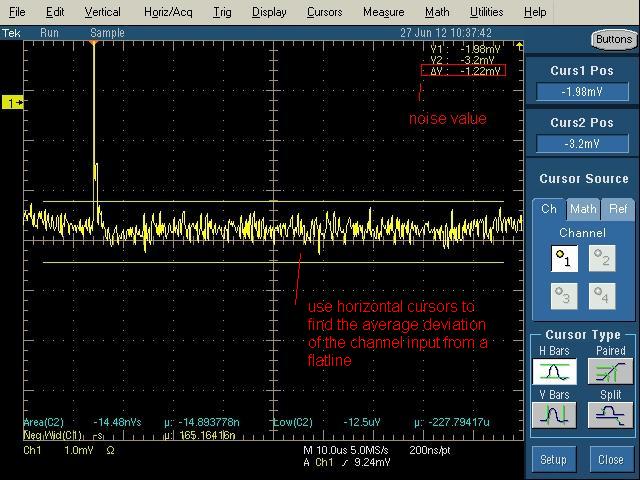
Instructions on finding the noise of a cable. Be sure to also wiggle the connectors at both ends to ensure that all noise is coming from solely the cable and not the connection to the pulser or the oscilloscope.
Spreadsheet and graph pending.
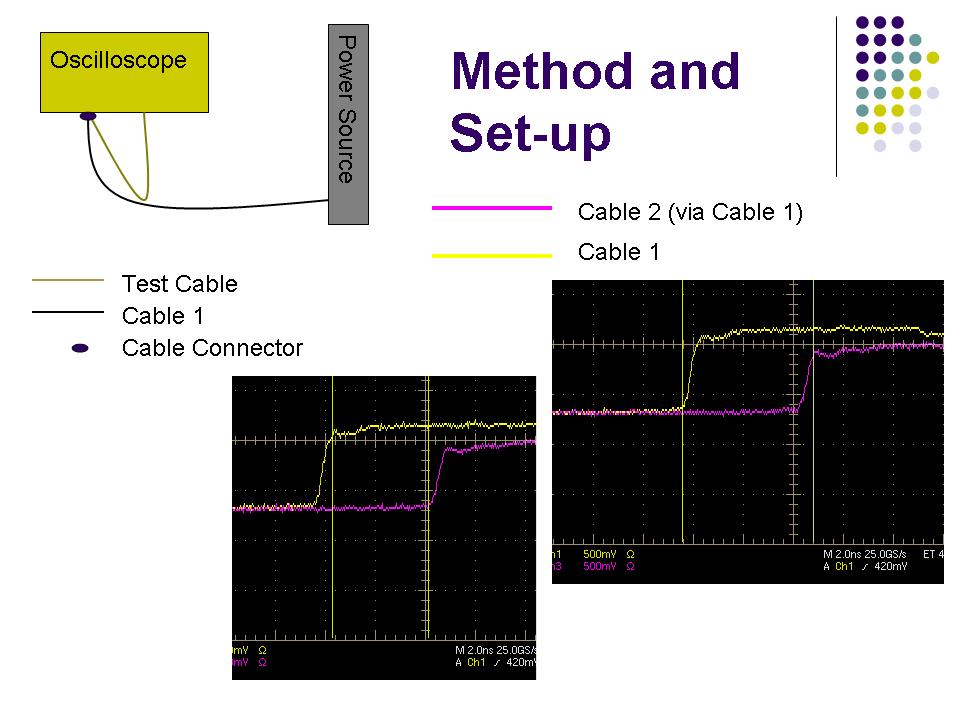
This invisible chart shows the relation between the length of each of the cables and the delay that they experience, as found using the above-described method. The slope of the graph (as shown by the trend-line equation) represents the approximate speed at which the current passing through the cable is traveling. The units for this slope are meters per nanosecond. The error bars vertically represent the uncertainty in the length measurement while the horizontal error bars are the range of the possible delay.