MainPage:Nuclear:NPS:PWO:Hardness
| ⇐ Back to Neutral Particle Spectrometer |
| ⇐ Back to the Main_Page |
Crystal Recovery
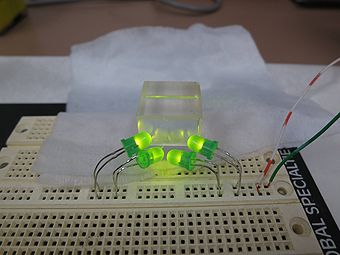
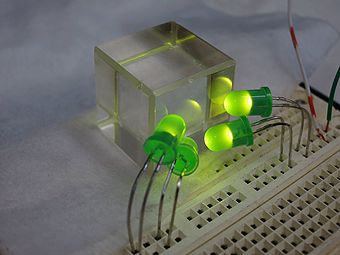
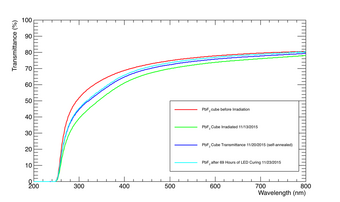
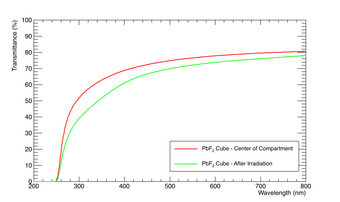
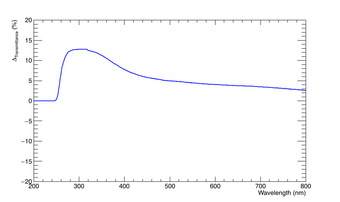
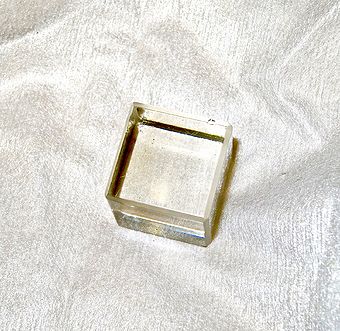
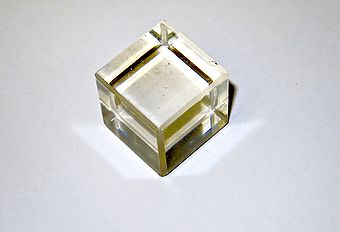
The PbF2 cube was annealed with LEDs (peak wavelength ~500nm) for 69 (94) hours. The optical transmittance results are shown in the figure below along with the transmittance curves before and after irradiation, as well as a curve of the transmittance after the crystal self-annealed for about one week. The dominant effect seems to be from self-annealing. A different set of shorter wavelength and higher intensity LEDs will be used next for more effective stimulated recovery.
X-Ray Irradiation
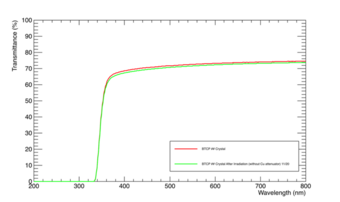
Irradiation of BTCP PbWO4 crystal (no Cu attenuator)
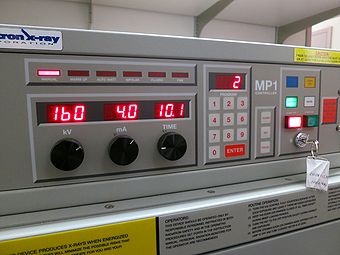
A measurement with a 20 cm long BTCP PbWO4 crystal was performed with the crystal placed at ~15 mm from the Xray source. This is closer than in previous tests. The settings were as follows: V=160 kV, I=6.1 mA, t=10 min. During the irradiation the crystal was observed to scintillate.
Results
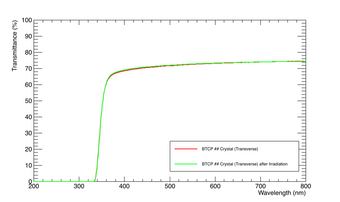
The scintillation mechanism did not seem affected by the irradiation. At these dose rates photon induced radiation damage in scintillating crystals like PbWO4 is thus caused by radiation induced absorption, or color center formation. To quantify any irradiation damage the optical transmittance was measured and compared to that before irradiation.
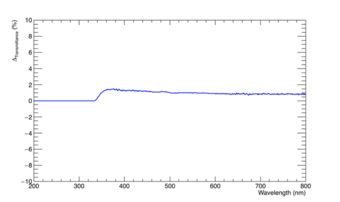
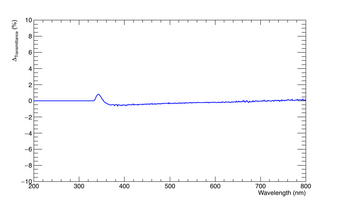
The transmittance before and after irradiation differs at the ~2% level for wavelengths 380-420 nm. However, the effect from radiation damage needs to be disentangled from other effects like positioning of the crystal.
Another aspect to take into account is the history of the crystal. Thermal annealing would allow to start with a completely recovered crystal.
Optical transmittance after irradiation (numerical values)
Dose Rate Measurements
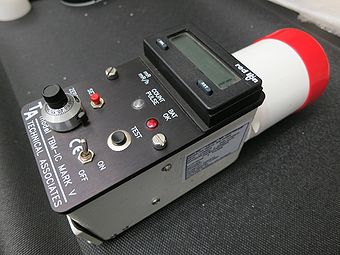
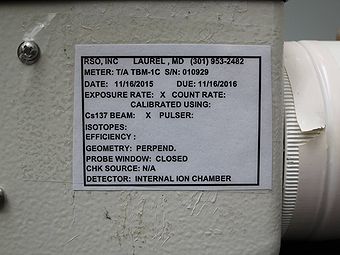
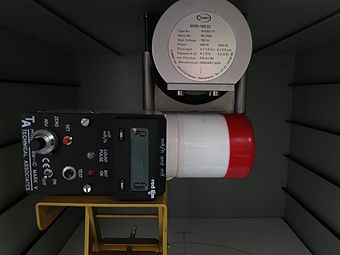
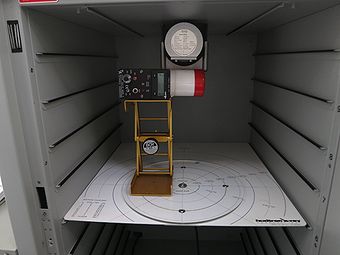
An ion chamber was used to determine the actual dose rate in the CP160 chamber. Note: the ion chamber has two settings. One is the dose rate (in mR/hr) and one displays counts at the rate of one count per second in a radiation environment on the order of 1 mR/hr. To convert one needs to divide the displayed numerical value by a factor of 3600.
As a first step the ion chamber was tested with a radioactive source (Cs-137, 1 uC in June 2015).
- The calculated dose rate for this source and this activity is 3.2 mR/hr
- With the ion chamber a rate of 1-2 mR/hr was measured. This is consistent with the calculated dose rate
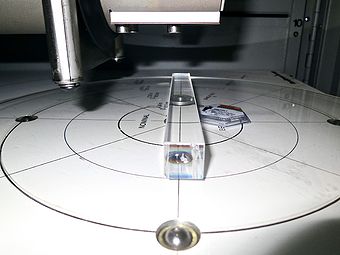
The ion chamber was then placed into the CP160 chamber. There were four test runs taken with the ion chamber at different locations inside the chamber. The following table shows the experimental conditions and resulting dose rates. The distance, d, denotes the vertical distance from the Xray source and IC centering refers to the horizontal displacement relative to the center line on the instrument turn table.
| d (inches) | V (kV) | I (mA) | Time (min) | IC centering | Exposure (mR/hr) | |
|---|---|---|---|---|---|---|
| First Run | 1 | 160 | 6 | 1 | inner beam circle | 9830 |
| Second Run | 4 | 160 | 6 | 1 | inner beam circle | 9820 |
| Third Run | 4 | 160 | 6 | 1 | displaced to the left to next beam circle | 9816 |
| Fourth Run | 4 | 160 | varies between 0.1 mA and 6 mA | 1 | displaced to the left to next beam circle | 9817 |
The results seem to be independent of the distance from the Xray source. This seems to suggest that the ion chamber saturates at about 10 kR/hr. The actual dose rate in the chamber is greater than 10 rad/hr.
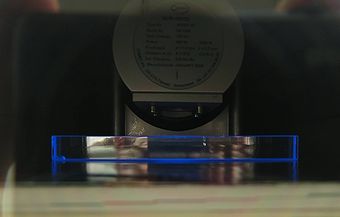
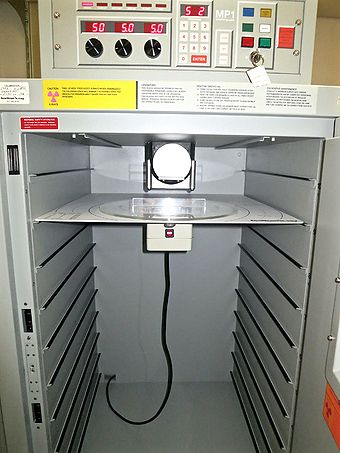
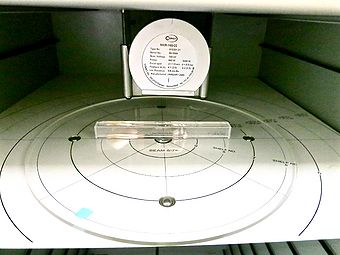
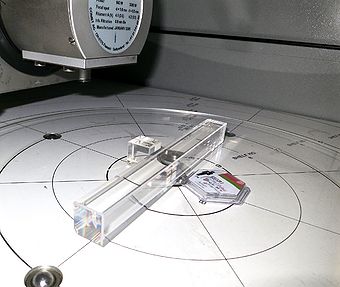
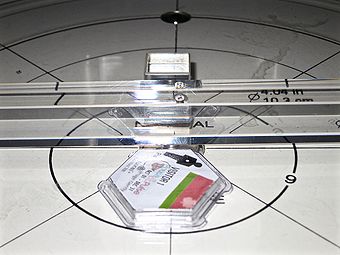
Pictures of Setup:
Initial Tests (with 0.5 mm Cu attenuator)
A series of tests were performed using the Faxitron CP160 instrument, a X-ray Irradiation system, to determine if the BTCP ## crystal and PbF2 crystal can irradiate. Measuring the transmittance of these crystals, before and after the irradiation, can help us understand the behavior of these crystals in high radiation environments.
There were a total of five runs these initial tests included involving the BTCP ## and PbF2 cube.
The following table shows the parameters set on the X-ray Irradiation system for each run with setting of 160 V (max).
| I (mA) | Exposure (krad/hr) | Time (min) | Crystals Tested | |
|---|---|---|---|---|
| First Run | 4 | ~30 | 10 | BTCP ## |
| Second Run | 5 | 35 | 10 | BTCP ## |
| Third Run | 6 | ~40 | 10 | BTCP ## |
| Fourth Run | 6 | ~40 | 10 | BTCP ## and PbF2 cube |
| Fifth Run | 6 | ~40 | 10 | BTCP ## and PbF2 cube (on top) |
Pictures of Setup:
Results
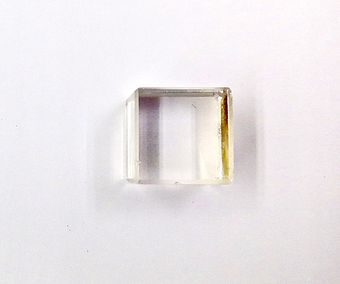
We were able to see visual and statistical evidence of irradiation on the PbF2 cube crystal.
Benchmark Tests
Pictures:
