MainPage:Nuclear:DVCS-3
| ⇐ Back to the Main_Page |
| ⇒ To DVCS Software/Computing/Batch How-to |
DVCS-3 Experiment
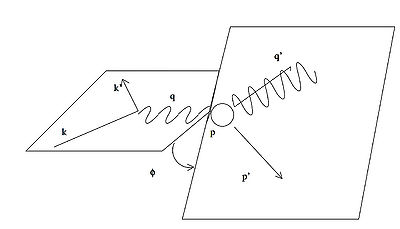
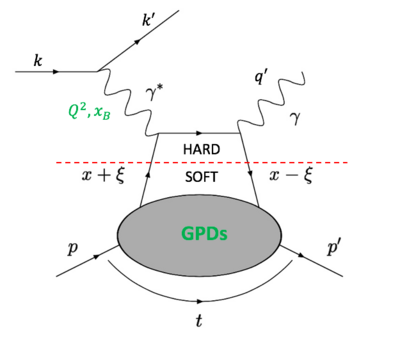
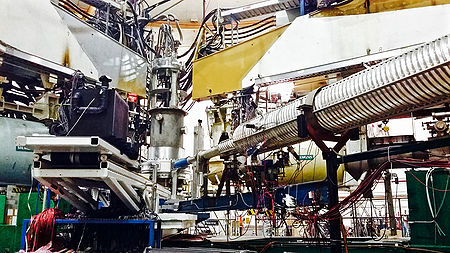
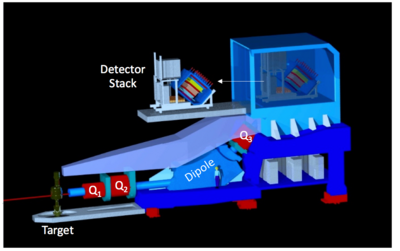
Deeply Virtual Compton Scattering (DVCS)-3 was an experiment that ran from 2014-2016 in Hall A (E12-06-114) and is one of the first experiments of the JLab 12 GeV era. The method of DVCS is the cleanest way to access Generalized Parton Distributions (GPDs). More information can be found on the DVCS-3 Hall A wiki page.
Kinematic Settings and runs
50% of data was taken for E12-06-114, the other 50% kin 60_2 (Q^2 @ 8.4), 60_4 (Q^2 @ 9.0) were not included. Quality analysis was done for all kinematics by Frederic. See elog entry here for it: Frederic's quality analysis for production runs
| Kinematic | Run ranges | E_beam | Q^2 | x_Bjorken |
|---|---|---|---|---|
| 36_1 | 10370-10649 | 7.361 | 3.2 | 0.36 |
| 36_2 | 14147-14261 | 8.517 | 3.6 | 0.36 |
| 36_3 | 14471-14525 | 10.62 | 4.5 | 0.36 |
| 48_1 | 12508-12650 | 4.480 | 2.7 | 0.48 |
| 48_2 | 13000-13015,13183-13261 | 8.843 | 4.4 | 0.48 |
| 48_3 | 12838-12999 | 8.843 | 5.3 | 0.48 |
| 48_4 | 13100-13162,13279-13418 | 11.00 | 6.9 | 0.48 |
| 60_1 | 14267-14470,14951-15177 | 8.517 | 5.5 | 0.60 |
| 60_3 | 14526-14950 | 10.52 | 8.4 | 0.60 |
DVCS Theory
Experimental Setup
Target Configuration for DVCS-3
Fall 2014 run period
See Target Config 10/20/2014 (by David Meekins)
Spring 2016 run period
See Target Config 02/19/2015 (by David Meekins)
Fall 2016 run period
See Target Config 10/11/2016 (by David Meekins)
Beam Position Monitor (BPM) Notes
See Kijun Park's Slides about BPM calibration 2/20/2016.
See Thir Gautam's slides about the BPM calibration 01/17/2017
HRS Detector Package
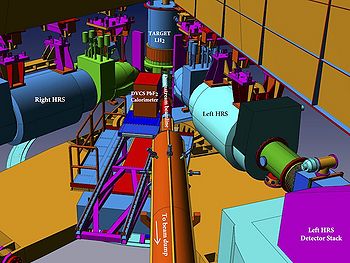
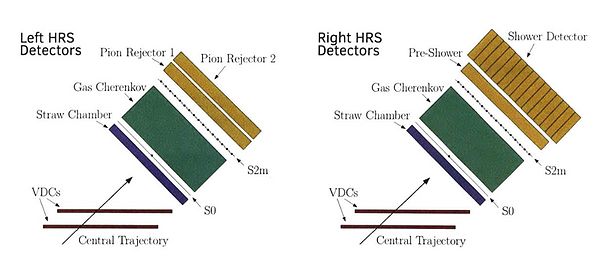
The detector package within the Left-HRS (High Resolution Spectrometer) include a set of Vertical Drift Chambers (VDCs) used for tracking, a Gas Cerenkov detector, scintillators S0, S1 and S2m, and a two-layer lead glass Pion Rejector.
Two layers of Vertical Drift Chambers (VDCs) are located at a 45 degree incline relative to the initial trajectory point of the particle. The VDCs are wire planes filled with an Argon and Ethane gas mixture (62:38) that are used to record tracking information of the particles entering the stack: reconstruction of the event vertex, particle momentum, and the scattering angle of the particles relative to the target via an optics matrix. Next, the particles pass through a trigger scintillator, S0 which is made from one 10 mm-thick plastic paddle. The particles then travel to the Gas Cherenkov detector, which is filled with CO2 gas and has momentum thresholds to differentiate between electrons (17 MeV/c) and pions (4.8 GeV/c). The particles then go through a second trigger scintillator S2 that is made from sixteen 5 mm plastic paddles. Finally, the particles pass through two layers of Pion Rejector (PR) layers that are electromagnetic calorimeters consisting of 34 lead glass blocks that each has 15 cm x 15 cm x 30 cm dimensions.
Calibrations (Left-HRS + PbF2 Electromagnetic Calorimeter)
Left-HRS Optics Calibration/Reconstruction
- "Pointing runs" - reconstruction of in (thetatg)and out-of-plane (phitg) angles to calculate the scattering angle (thetascat), taken with beam on carbon multi-foil target (5 or 9 depending on length of target), with sieve-slit inserted in front of spectrometer.
- "Optics runs" - reconstruction of event vertex (ytg), taken with beam on carbon multi-foil target, without sieve-slit.
- "Dummy runs" - reconstruction of target length, taken with beam on Aluminum.
- "Delta scans" - reconstruction of the spectrometer momentum, taken with beam on LH2 target, without sieve-slit. Central momentum is scanned in small steps while holding the spectrometer angle fixed.
- List of all alignment surveys in Hall A
Some relevant literature to understand how the optics calibration is performed in Hall A of JLab
Fall 2014/Spring 2015 optics runs
Summary (Ref: C. Hyde eLog entry):
Data taken for sieve at W=1.5, all carbon foil target
- swing 17:00 Tues 28-apr-2015 through 15:00 Wed 29-Apr-2015
- LHRS sieve runs at 25 degrees
- Runs with Q1 B=-0.06883 at nominal setting 11336,11337,11351,11352
- Runs with Q1 B=-0.5457 at 79.3% of readback current are 11338-11342,11353-11358.
- Q1 was off for runs 11343-11352.
Data taken for elastic delta scan all LH2 target - see logbook entry: Hall A Logbook Entry 3336840
- Swing 20:00 Wed 29-Apr-2015 to 00:11 Thur 30-Apr-2015
- Run 11361 Q1=1336.93 B=-0.11112 nominal 4% delta p=1.777
- Run 11362 Q1=1060.44 B=-0.08819 at 79.3% of readback -4% delta p=1.777 DAQ crashed to end run
- Run 11363 Q1 tripped off
- Run 11364 do not know what happened
- Run 11365 Q1=1060.44 B=-0.08819 at 79.3% of readback -4% delta p=1.777 good run
- Run 11366 Q1=1038.92 B=-0.0864 at 79.3% of readback -2% delta p=1.741 good run
- Run 11367 Q1=1018.09 B=-0.08464 at 79.3% of readback -0% delta p=1.70595 good run
- Run 11368 Q1=997.742 B=-0.08298 at 79.3% of readback +2% delta p=1.67194 good run
- Run 11369 Q1=978.729 B=-0.08141 at 79.3% of readback +4% delta p=1.63997 good run
- Run 11370 Q1=978.729 B=-0.08141 at 79.3% of readback +4% delta p=1.63997 good run
Acceptance tests
- 04:00 04-May-2015 to 07:00 04-May-2015
- Run 11456 Q1= 536.843 B=-0.0446 at 79.3% of readback p=0.900 LH2
- Run 11457 Q1= 536.843 B=-0.0446 at 79.3% of readback p=0.900 15cm dummy
- Run 11458 Q1= 536.843 B=-0.0446 at 79.3% of readback p=0.900 carbon
- Run 11459 Q1= 607.874 B=-0.0505 at 79.3% of readback p=1.019 carbon
- Run 11461 Q1= 607.874 B=-0.0505 at 79.3% of readback p=1.019 15cm dummy
- Run 11463 Q1= 607.874 B=-0.0505 at 79.3% of readback p=1.019 LH2
Sieve slit survey from Spring 2015
Spring 2016 optics runs
- Summary of optics runs by F. Georges: Hall A Logbook Entry 3383651
- Summary of delta scan runs by F. Georges: Hall A Logbook Entry 3384771
- Spectrometer Central Angle Survey from Spring 2016
Fall 2016 optics runs
- Pointing runs (12C 9 foil target, raster off)
- Spectrometer Central Angle survey end of production
- Spectrometer Central Angle survey (60_1, 60_3)
- Spectrometer Central Angle survey (60_1, 60_3)
| Kin No. | Run Period | Run No. | Run Type | Target |
|---|---|---|---|---|
| kin 36_2 | Fall 2016 | 14251 | Dummy | 15 cm Al (7075) |
| kin 48_1 | Spring 2016 | 12639 | Dummy | 15 cm Al (7075) |
| kin 48_1 | Spring 2016 | 12686 | Optics | 5 carbon foils |
| kin 48_2 | Spring 2016 | 13223 | Dummy | 15 cm Al (7075) |
| kin 48_2 | Spring 2016 | 13006, 13218, 12845 | Pointing | 5 carbon foils |
| kin 48_3 | Spring 2016 | 12845 | Pointing | 5 carbon foils |
| kin 48_4 | Spring 2016 | 13152, 13282, 13412 | Pointing | 5 carbon foils |
| kin 60_3 | Fall 2016 | 14766 | Dummy | 15 cm Al (7075) |
Deadtime Analysis
The deadtime is defined as the ratio of the number of "live" events going into the electronics or computers to the total number of events. The deadtime calculations are crucial for the calibration process after an experiment. The electronic and computer deadtime need to be quantified and applied in order to eventually extract precision measurements of the cross section. This analysis specifically focused on checking the DAQ, or computer deadtime for DVCS rates. Main dedicated deadtime run in this analysis was 13418 (10 uA, 15 uA, 20 uA) part of kin 48_4, with reproducibility checks done using runs 12901 (10 uA), 12985 (15 uA) part of kin 48_3.
- For run 13418: Prescale, clustering, beam information etc. available in logbook - Hall A Logbook entry for 13418 (WARNING: NEED JLAB CREDENTIALS TO VIEW).
- For run 12901: Hall A Logbook entry for Start of run 12901 (WARNING: NEED JLAB CREDENTIALS TO VIEW) and Hall A Logbook entry for End of run 12901 (WARNING: NEED JLAB CREDENTIALS TO VIEW).
- For run 12985: Hall A Logbook entry for Start of run 12985 (WARNING: NEED JLAB CREDENTIALS TO VIEW) and Hall A Logbook entry for End of run 12985 (WARNING: NEED JLAB CREDENTIALS TO VIEW)
Trigger Diagrams
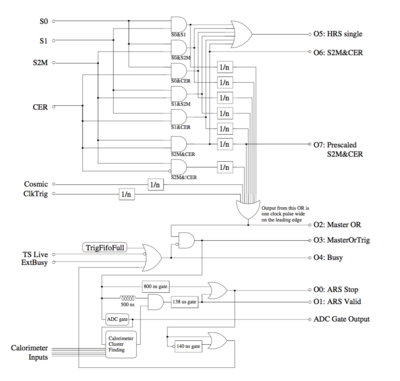 Trigger diagram for internal logic (reference) |
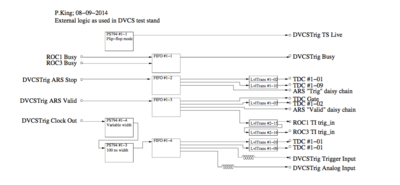 Trigger diagram for external logic (reference) |
Refer to DVCS_readiness_review_report.pdf
Relevant Terminology
- Scalars - two types of scalars, internal and external to the trigger or detector. For each set of internal and external set of scalars, there are corresponding live and raw scalars. The livetime is then the ratio of the live scalar to raw scalar.
- External Scalars (list borrowed from here). Note that blank spaces after numbers means that those channels were not being used. These scalers correspond to the prefix "gated_accum_dvcs_xx" or "accum_dvcs_xx" in the root trees where "gated_accum_dvcs_xx" are the live rates, and the "accum_dvcs_xx" are the raw rates. This list is beginning with "0" to represent the actual scalers in the root tree. Other scalers have prefix's "dvcs_scaler_xx" and "gated_dvcs_scaler_xx". I am uncertain of what these represent. I *think* dvcs_scaler_xx is the step size in the scalers. Each of the scalers have two of these scalers in the root tree in addition to the ones noted below: each trigger has 4 scalers. I am just listing the ones relevant to my study, which are the live and raw scalers.
| 0. | 512 ns clock from DVCS trigger crate: gated_accum_dvcs_scaler_slowclock (live), accum_dvcs_scaler_slowclock (raw) |
| 1. | DVCS cosmic trigger: gated_accum_dvcs_scaler_cosmics (live), accum_dvcs_scaler_cosmics (raw) |
| 2. | S0: gated_accum_dvcs_scaler_s0 (live), accum_dvcs_scaler_s0 (raw) |
| 3. | S2: gated_accum_dvcs_scaler_s2 (live), accum_dvcs_scaler_s2 (raw) |
| 4. | CER: gated_accum_dvcs_scaler_CER (live), accum_dvcs_scaler_CER (raw) |
| 5. | EDTM: gated_accum_dvcs_scaler_EDTM (live), accum_dvcs_scaler_EDTM (raw) |
| 6. | DVCS External Clock or LED Trigger: gated_accum_dvcs_scaler_CLOCK_LED (live), accum_dvcs_scaler_CLOCK_LED (raw) |
| 7. | ARS Stop: gated_accum_dvcs_scaler_ARSStop (live), accum_dvcs_scaler_ARSStop (raw) |
| 8. | ARS Valid: gated_accum_dvcs_scaler_ARS_Valid (live), accum_dvcs_scaler_ARS_Valid (raw) - Scalers representing this validation rate was used for DVCS trigger rates in previous studies. Go to Mongi's ELOG entry for more info. |
| 9. | DVCS calorimeter ADC gate: gated_accum_dvcs_scaler_ADC_gate (live), accum_dvcs_scaler_ADC_gate (raw) |
| 10. | inverted S0: gated_accum_dvcs_scaler_invertedS0 (live), accum_dvcs_scaler_invertedS0 (raw) |
| 11. | inverted S2: gated_accum_dvcs_scaler_invertedS2 (live), accum_dvcs_scaler_invertedS2 (raw) |
| 12. | inverted CER: gated_accum_dvcs_scaler_invertedCER (live), accum_dvcs_scaler_invertedCER (raw) |
| 13. | L1A: gated_accum_dvcs_scaler_13 (live), accum_dvcs_scaler_13 (raw) |
| 14. | CaloBlock001: gated_accum_dvcs_scaler_14 (live), accum_dvcs_scaler_14 (raw) |
| 15. | External S2M_CER: gated_accum_dvcs_scaler_15 (live), accum_dvcs_scaler_15 (raw) |
| 16. | 64ns clock from DVCS trigger crate: gated_accum_dvcs_scaler_16 (live), accum_dvcs_scaler_16 (raw) |
| 17. | 512ns clock from DVCS trigger crate (2): gated_accum_dvcs_scaler_17 (live), accum_dvcs_scaler_17 (raw) |
| 18. | |
| 19. | |
| 20. | |
| 21. | |
| 22. | |
| 23. | |
| 24. | Master_OR: gated_accum_dvcs_scaler_24 (live), accum_dvcs_scaler_24 (raw) |
| 25. | Master_OR Live: gated_accum_dvcs_scaler_25 (live), accum_dvcs_scaler_25 (raw) Note: not sure if this is really Master_OR Live, that's why we use Master OR. |
| 26. | HRS_Single: gated_accum_dvcs_scaler_26 (live), accum_dvcs_scaler_26 (raw) |
| 27. | S2M_CER: gated_accum_dvcs_scaler_27 (live), accum_dvcs_scaler_27 (raw) |
| 28. | S2M_CER_Scaled: gated_accum_dvcs_scaler_28 (live), accum_dvcs_scaler_28 (raw) |
| 29. | |
| 30. | 103 kHz clock from spectrometer (DVCS clock in crates): gated_accum_dvcs_scaler_30 (live), accum_dvcs_scaler_30 (raw) |
| 31. | BCM signal: gated_accum_dvcs_scaler_31 (live), accum_dvcs_scaler_31 (raw) |
- Internal Scalers - "cpt" prefix, to be distinguished from the external scalers.
- Beam Current Monitor (BCM) - works to measure a stable and non-interfering beam current measurement.
- Beam Position Monitor (BPM) - used to determine the position and direction of beam at the target.
- Analog Ring Sampler (ARS) - consists of an array of capacitor cells that work to sample the signals coming from PMTs by storing them. Stop and valid signals are the two signals that control the behavior of the ARS. The valid signal instructs the charge of each capicitor to be digitized, and the stop signal instructs the ARS to stop sampling, which occurs when all the capicitor cells are in a "hold" state, or isolated state. The valid signals correspond to the ARS Valid Rate, which is used as the trigger rate in the calculation of the deadtime.
- S2M&&CER - S2M and Cherenkov gas detectors are used in conjunction to form a trigger for a DVCS event, which is why we use these detectors to calculate the deadtime. When this trigger is formed, a signal is sent to the Master OR live and then to the ARS which sends an ARS valid signal. See above for more trigger information.
Scaler raw and live rates, and Livetime
Below are tables that show different raw and live rates of important scalers influencing the deadtime computation.
| I (uA) | S2M (Hz) | S0 (Hz) | S2M & Cherenkov (Hz) | Master OR (Hz) |
|---|---|---|---|---|
| 0 | 212 | 101.8 | 13.9 | 23.4 |
| 10.61 | 6494 | 2074 | 137 | 145.8 |
| 15.32 | 9262 | 2960 | 200 | 214 |
| 20.53 | 12350 | 3927 | 273 | 288.5 |
| I (uA) | S2M (Hz) | S0 (Hz) | S2M & Cherenkov (Hz) | Master OR (Hz) |
|---|---|---|---|---|
| 0 | ||||
| 10.61 | 6394 | 2040 | 134.6 | 143.3 |
| 15.32 | 9041 | 2885 | 194.6 | 208.1 |
| 20.53 | 11920 | 3783 | 262.9 | 277.9 |
| I (uA) | S2M LT | S0 LT | S2M & Cherenkov LT | Master OR LT |
|---|---|---|---|---|
| 0 | 0.997 | 0.998 | 0.997 | 0.999 |
| 10.61 | 0.985 | 0.984 | 0.983 | 0.983 |
| 15.32 | 0.976 | 0.975 | 0.973 | 0.972 |
| 20.53 | 0.965 | 0.963 | 0.963 | 0.963 |
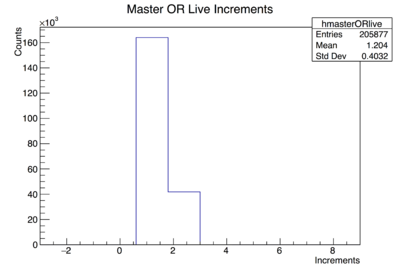
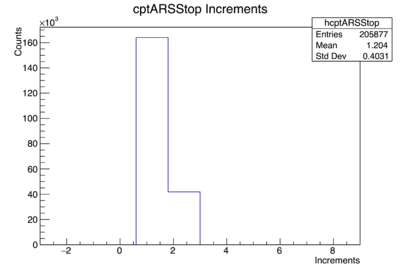
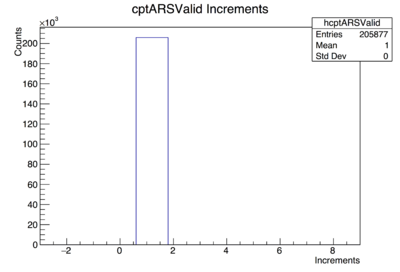
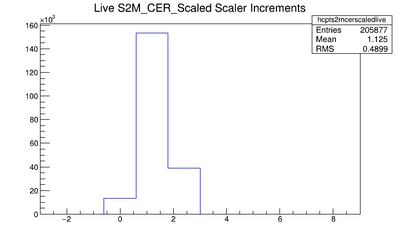
"Random" counting scalers were brought to attention due to S2m&&Cer live scaler not counting the same way as the ARS valid scaler. There is now a solution of why they do not count the same way: S2m&&Cer signals are not validated by the ARS after forming a trigger. However, to make sure the scalers are counting correctly, the ARS stop and Master OR Live were checked and they do count the same way. Below are plots showing the results of this check e.g. showing how each scaler counts from one entry to the next. Notice that ARS Stop and Master OR count/increment the same way, and ARS Valid and S2m&&Cer do not do so.
Current Dependence Studies
Taking raw rates and normalizing them with the current (Hz/uA), and subtracting the pedestal (taken during a run when there was no current, specifically run 13402).
| I (uA) | S2M (Hz/uA) | S0 (Hz/uA) | S2M & Cherenkov (Hz/uA) | Master OR (Hz/uA) |
|---|---|---|---|---|
| 0 | 212 Hz (raw) | 101.8 Hz (raw) | 13.9 Hz (raw) | 23.4 Hz (raw) |
| 10.61 | 592 | 186 | 11.6 | 11.5 |
| 15.32 | 591 | 187 | 12.1 | 12.4 |
| 20.53 | 591 | 186 | 12.6 | 12.9 |
Real Coincidences: CODA event-based rates
Since there was still a current dependence still apparent despite current normalized raw rates, we decided to look at the full CODA event-based rates and applied appropriate electron and tracking cuts...
| I (uA) | S2M&&CER LT | Rate (Hz/uA): no cuts | Rate (Hz/uA): tracking cuts | Rate (Hz/uA): tracking&TDC cuts | Rate (Hz/uA): tracking&TDC&Cer cuts | Rate (Hz/uA): tracking&TDC&Cer&DIS cuts | tracking&TDC&Cer&DIS/S2M&CER LT |
|---|---|---|---|---|---|---|---|
| 0 | n/a | 16.26 | 0.150 | 0.150 | 0.030 | n/a | |
| 10.61 | 0.985 | 9.27 | 5.783 | 5.719 | 5.138 | 3.365 | 3.422 |
| 15.32 | 0.976 | 10.26 | 6.192 | 6.117 | 5.484 | 3.356 | 3.450 |
| 20.53 | 0.965 | 11.26 | 6.459 | 6.391 | 5.733 | 3.321 | 3.449 |
| I (uA) | S2M&&CER LT | Rate (Hz/uA): no cuts | Rate (Hz/uA): tracking cuts | Rate (Hz/uA): tracking&TDC cuts | Rate (Hz/uA): tracking&TDC&Cer cuts | Rate (Hz/uA): tracking&TDC&Cer&DVCS cuts | tracking&TDC&Cer&DVCS/S2M&CER LT |
|---|---|---|---|---|---|---|---|
| 0 | n/a | 16.26 | 0.150 | 0.150 | 0.030 | n/a | |
| 10.61 | 0.985 | 9.27 | 5.783 | 5.719 | 5.138 | 5.134 | 5.212 |
| 15.32 | 0.976 | 10.26 | 6.192 | 6.117 | 5.484 | 5.480 | 5.615 |
| 20.53 | 0.965 | 11.26 | 6.459 | 6.391 | 5.733 | 5.728 | 5.936 |
The two tables above are shown for comparison purposes, main difference between the two being the DIS and DVCS rates. DIS rates were calculated using a variable called "TriggerPatternWord&0x00080". Table 2 shows that although the DIS current dependence vanishes when normalizing with the current, the DVCS-rate current dependence remains as shown on Table 3. The DIS rates do not tell us much since they represent electron triggers only, and do not take into account the calorimeter coincidences.
The DVCS rates were found by using "TriggerPatternWord&0x00100". The DVCS rates are still dependent on the current, as shown on Table 3. We think that this may be due to random coincidences between the DVCS calorimeter and the LHRS (S2M&&Cer).
Extraction of Accidentals
under construction
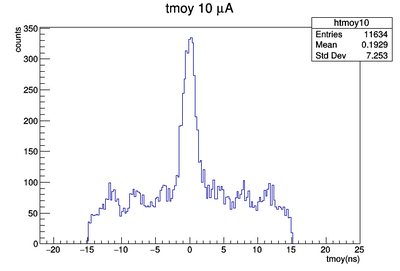
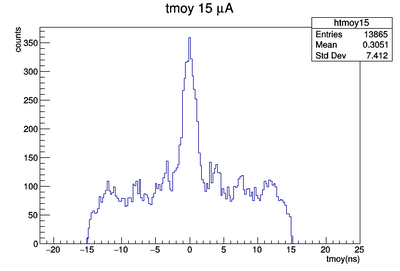
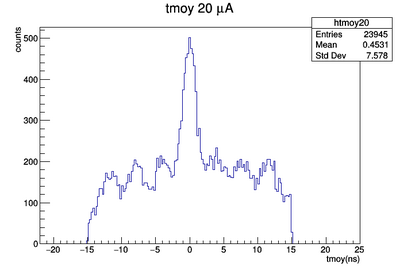
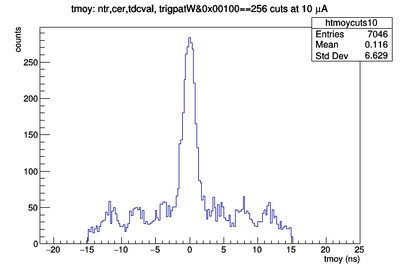
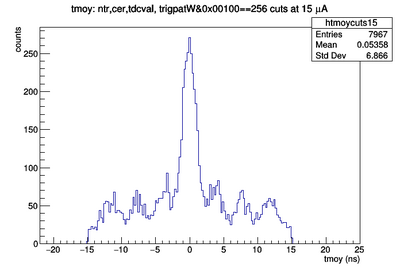
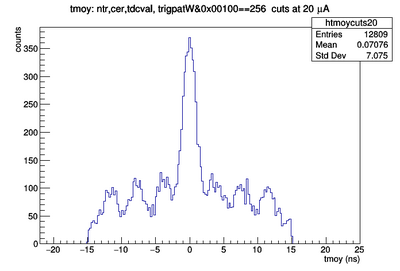
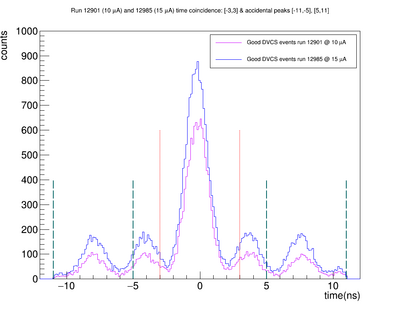
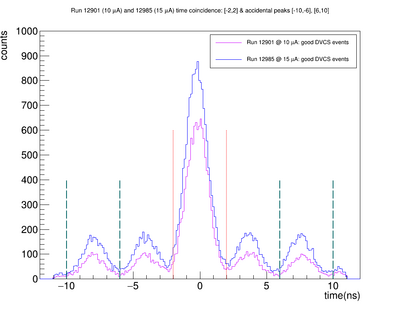
A waveform analysis technique has been employed to account for random coincidences or accidentals coming from the calorimeter by utilizing a calorimeter clustering algorithm. There are certain clusters in the calorimeter that can allow us to reconstruct the coincidence time of the events (photons) in the calorimeter. The time relative to the coincidences occurring in the calorimeter is an important factor to use this calorimeter clustering algorithm. Below are plots from the analysis, including "tmoy" which is the time distribution of the coincidences (accidental and true). We need to figure out how to distinguish the two by finding the range in which the accidentals are.
We have applied the same cuts to this time distribution (tmoy) as we did for the DVCS rates for TDC (tdcval[27]-tdcval[7]/10<24), tracking (ntr<0), cerenkov (cer>500), trigger pattern word(trigpatW&00100 ==256).
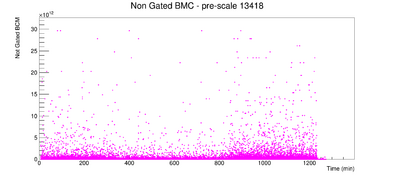
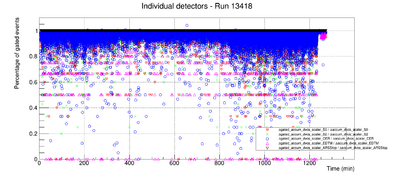
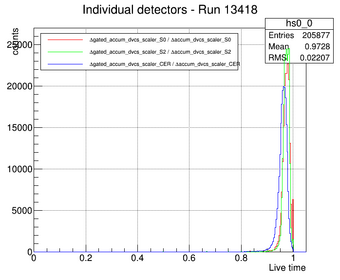
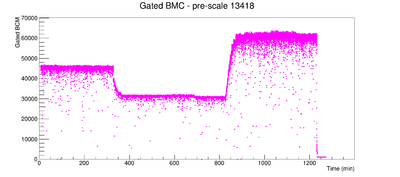
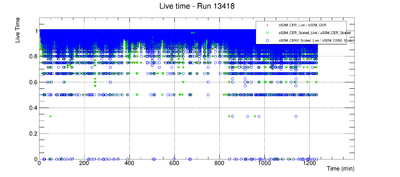
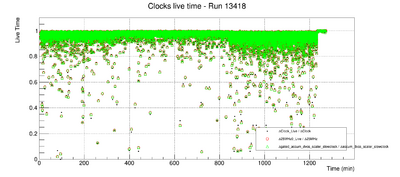
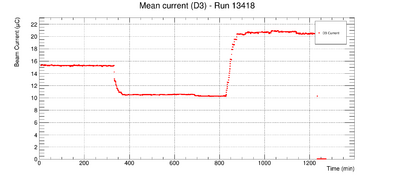
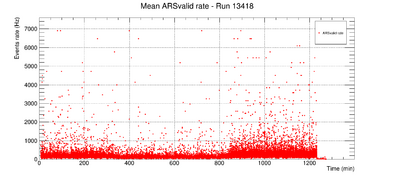
Plots from run 13418: dedicated deadtime analysis run
8/9/2017 - 7/3/2018: Presentations and Reports for DAQ deadtime studies
- Report on progress 7/3/2018 for DVCS-3 Weekly Meeting: deadtime progress 7/3/2018
- Comments and Suggestions: DAQ Deadtime studies officially conclusive. Deadtime correction applied to all rates are correct and dt varies btw 2% and 4% between 10 and 20 uA. See report for more details.
- My notes: Everyone agreed with deadtime results. Moving on to thesis work: analyzing pi0 data to measure pi0 cross section. Starting with kin 48. Carlos suggested talking to Mongi about process for pi0 analysis for kinematic 36_1,
- Report on progress 6/26/2018 for DVCS-3 Weekly Meeting: deadtime progress 6/26/2018
- Comments and Suggestions: Good to check deadtime correction using my procedure (e.g. normalized rates and accidental subtraction application to recover DVCS rates to better than 1%) for other runs such as 12901, 12985 (Julie).
- My notes: Checked deadtime correction procedure, can present something for a future meeting (either next week or the week after).
- Report on progress 6/12/2018 for DVCS-3 Weekly Meeting: deadtime progress 6/12/2018
- Comments and Suggestions: Choosing the width of signal and background window i.e. 4 ns should match with 4 ns, and 6 ns with 6 ns windows (Alex and Mongi); comments on moving from scaler computed livetime to event-based livetime(Julie), comments on a global deadtime correction factor (Carlos).
- My notes: matched windows and scaled to 6 ns signal/background ratio - better recovery of DVCS normalized rates (<1% as opposed to the 1.33% before); deadtime correction factor has to be computed for each run using main triggers S2m&&Cer; need to still include old scaler results
- Slides from DVCS collaboration meeting: deadtime_pres_1.26.2018
- 4/11/2018 Google sheets doc for kinematics of dvcs experiment (plus my own edits...work in progress, lots of things missing (ps, trig)) here
- Slides for NP meeting 1.10.2018: SFA slides_deadtime_progress_DVCS-3 1/10/2018
- Report on progress 1/8/2018: deadtime progress 1/8/2018
- Report on progress presented on 11/14/2017 for DVCS-3 weekly meeting: deadtime progress 11.14.2017
- Description: Presented on computations involving scaling of coincidence time window (80 ns) to get scaled DVCS normalized rates (to get rid of current dependence), which involved using the ARS peak time and ADC values.
- Comments: Carlos suggested checking equations for the scaled DVCS rates since the discrepancy went up from 5% to 8%. Need to confirm with Paul if correct equations.
- Slides presented on 9/26/2017 for DVCS-3 weekly meeting: deadtime progress 9.26.2017
- Description: Updates on random counting scalers- S2m&&Cer signals are NOT validated by ARS after forming trigger. More on this below; Computed signal/background ratio by sectioning out 4 ns window of coincidence peak and accidental region, and applied it to DVCS normalized rates.
- Comments: Need to scale time coincidence window to online trigger and apply to signal/background ratio. Check with Paul for exact value of this. Is this the gate width of 100 ns during the run? More on this here.
- Slides presented on 9/20/2017 for CUA NP weekly meeting: deadtime progress 9.20.2017
- Slides presented on 9/5/2017 for DVCS-3 weekly meeting: deadtime progress 9.5.2017
- Description: Slides including ARS stop and ARS valid logic, waveform analysis update to address random coincidence problem within DVCS calorimeter and LHRS.
- Comments: Need to apply cuts to ntuple, tmoy same as for DVCS rates; "random" counting scalers still not very understood since S2m&&Cer Live signal represents coincidence of spectrometer & calorimeter so it should just count by 1..see below for more. (Paul will join meeting next week).
- Slides presented on 8/22/2017 during DVCS-3 weekly meeting: deadtime progress 8.22.2017
- Description: Slides include histograms showing how one CODA event increases to the next in hopes of narrowing down the problem of random counting scalers.
- Comments: Solved random counting scaler issue thanks to Carlos. Found a possible solution to solving current dependence mystery on current normalized DVCS rates. More information here here and above in updates.
- Slides presented on 8/9/2017 during NP group weekly meeting: deadtime progress 8.7.2017
- Description: Explaining current dependence and random counting scaler problems.
- Comments: Marco suggested to look at triggerPatternWord counting variable but this does not work for individual scalers just CODA events.
Updates and Progress from DAQ deadtime analysis
- The master OR issue- 8/5/2017 : The master OR, which is one of the scalers/counters for the S2M and Cherenkov detectors (the main detectors that were responsible for detecting DVCS events during the experiment), seems to have different live/raw scaler rates when comparing to CODA event-based rates. These should be the same, and we think that this happens because of random counting within the scalers. More info here.
- ***Update (8/22/17): this issue has been resolved since it makes sense that the Master OR has a slightly larger rate than the CODA event-based rate since the calorimeter inputs are included in the coincidences which go into the Master OR.
- ***Update (9/5/17): This may still be an issue since it is still not clear the source of the counting of scalers. Is this really "random" or just expected?
- ***Update (9/12/17): Suggested to check consistency with ARS Stop and Master OR live...and ARS valid and S2m && Cer live
- ***Update (9/20/17): Solved. ARS Stop and Master OR Live count the same, and ARS valid and S2m && Cer live should not. More details here.
- Current dependence issues (all updates)
- ***Update (8/22/17): Still a mystery. Account for the random coincidences between the calorimeter and S2m&&Cer by looking at singles rates with the HRS and the calorimeter, and/or finding a way to normalize the DVCS normalized rates with a dvcs livetime correction factor, and/or finding a way to subtract the DIS rates from DVCS rates which is maybe causing the current dependence.
- ***Update (8/23/17): Marco suggested to look at EDTM LT correction to apply to DVCS normalized rates instead of S2M&&Cer LT. Discrepancy of rates across currents decreases by 1%, but still at 11.4%. Perhaps move forward to account for random coincidences in calorimeter and correct rates.
- ***Update (9/5/17): Need to look at accidentals by analyzing waveform analyzed ntuples, and subtract from main coincidence peak. More details here.
- ***Update (9/24/17): Need to apply correction for signal/background ratio. Report on progress here.
- ***Update (11/10/17): Discussed with Paul King about correction factor. Think it is 80 ns. Need to adjust ratio by scaling to 80 ns. Need to contact Paul again to make sure it is 80 ns. Need to also gather plots of ARS/ADC as a function of time spectrum, and present in next DVCS-3 meeting.
- ***Update (11/20/17) Paul suggested that ADC gate width scaling does not align with current dependence issue since DIS triggers are being used. Need to re-check method used to apply the "signal to background ratio" to the rates because something is wrong.
- ***Update (12/1/17)Paul and I agreed with our calculations but no explanation to the persistence of the current dependence for DVCS rates. He suggested to use DIS accidentals from the time coincidence spectra instead of the previously used DVCS to get the accidental-subtracted DVCS rates. Obtained this signal/total ratio from triggerPatternWord cut for DIS only (on the time spectra for each current), and applied to DVCS normalized rates but no improvement on removing current dependence.
- ***Update (1/8/18) Another suggestion was to look back at how the calorimeter and spectrometer data was analyzed after the waveform analysis (using the ana.C script). Nothing seems wrong. The variables were correctly added and no apparent mistakes in making the output trees (ntunew_kin48_4_13418_xxuA.root files).
- ***Update (1/9/18) Decided to add cuts and apply tracking, Cerenkov, TDC and triggerPatternWord cuts to get DIS accidental rates and "subtract" from DVCS normalized rates. Previously, I was just using the rates from the DIS triggerPatternWord. The additional cuts resulted in the current dependence decreasing by a factor of 2, and percent difference per 10 uA is ~6%. This is still preliminary..need to still make sure method of "subtraction" is correct, and using DIS signal/total ratio instead is the right way to go.
- Main goal was to test if the livetime/deadtime is computed correctly: we do this by finding runs in the experiment with varying prescale or current (with one fixed) and see if we can recover the DVCS production rates.
- Take a trigger rate/live rate and normalize using the current and adjust to the prescale (so we can eventually apply to LTCF)
- To make sure the deadtime is correctly computed, the deadtime, current and prescale factors should be in agreement within 1%, especially for the range of rates in which the deadtime is linear.
- Studied run from Spring 2016 data (kin 48_4): Taken in April 2016, 13418 which was a dedicated run for the deadtime beam current variation analysis, at three different currents (10, 15, 20 uA) using a liquid hydrogen target.
- There are other dedicated deadtime runs taken in February 2016 with a carbon target, 12471 to 12476 at a current of ~5 uA with different prescale factors. The DVCS scaler-based rates were used (e.g. ARS Valid) and LTCF applied to these rates were able to correct the deadtime to better than 1%.
- Other runs to look at in this deadtime analysis include 10555 (~5 uA),10595(~7 uA),10622(~9.7 uA),10640(~6.8 uA), and comparing 12901 (10uA) 12985 (15 uA)
- 8/5/2017- There is a current dependence of live scalers when looking at dvcs events S2M and Cherenkov detectors, despite normalization using currents (to get rid of the dependence). This may be due to random coincidences between the two detectors...but still need to find out. More details here.
- 6/21/18- Current Dependence of DVCS rates normalized by current and S2m&&Cer LT solved for run 13418: After understanding the clustering analysis of the calorimeter, in addition to the collaborative efforts and suggestions (thank you to Carlos, Julie, Mongi, Alex etc.) I have successfully applied the DVCS signal/background ratios to the DVCS normalized rates, and was able to recover the rates to better than 1%.
- ***Update (6/26/18) Checking for reproducibility of results for run 12985 (15.81 uA), 12901 (10.86 uA). More stats: 12985 has 500K events, 12901 has 300K events. Right now DVCS rates have a 6% agreement without accidental corrections (same as the 6-7% agreement from run 13418-100K entries between 5 uA).
- ***Update (6/28/18) Added output text file to deadtime script dt_1run_06272018.C (in /volatile/halla/dvcs/salina/deadtime/) so need to use values from Trig_liveraw_current_output_run**.txt for trigger rates (S2mCer, S2m, S0, Master OR) and Current_dep_rates_eventbased_and_norm_run** which gives the dvcs and dis scaler and event-based rates plus Hashir's cuts. Waveform analysis didn't work on farm so via dowf2p_sfa.C so Frederic sent waveform files.. Used ana_salina_1run.C for the analysis of ana_salina_1run_12901.root and ana_salina_1run_12985.root. Need to just get accidentals and accidental ratios. Already modified script which is "ana_salina_ntu1_1run.C" in /home/alis/dvcs/waveformana/.. ana_salina_1run.C is also working on the farm via analyzer..but still no dowf2p**.C ? Need to find out why because will need to make it work eventually for pi0 analysis.
- ***Update (6/30/18) Made dt script and ana_salina_ntu1_1run.C more user-friendly; have results. Was able to reduce the current dependence from 6% in DVCS rates down to 0.55% for new runs 12901(10 uA), 12985 (15 uA). But didn't have to use 6 ns accidental windows.. 4 ns windows had a better reduction. This is probably because of a lot of statistics in these runs. Anyway, I compare both:
- Working on more plots via /home/alis/dvcs/waveformana/ana_salina_ntup1_3currents.C for 13418 to put on final report...(wanted to include a 4 ns plot as a comparison.)
- Also, apparently the disk quota is exceeded on /work/halla/dvcs/disk1/ ? Hopefully this changes by tomorrow.
- 7/1/18- Reproducibility check for runs 12901, 12985 - Current Dependence of DVCS rates normalized by current and S2m&&Cer LT solved for runs 12901 and 12985 : Pedestal subtraction for both DIS and DVCS rates is very important!! Pedestal from GoodEventCut&TDC was subtracted from DVCS and DIS rates, and the accidental subtraction further reduced discrepancy of DVCS normalized rates to 0.03% using the 4 ns windows, and a 0.4% discrepancy using the 6 ns windows!
GEant4 Simulation
How to use?
- Some links
Important ELog Entries
- Mongi's ELog update: DVCS ELOG LOGIN REQUIRED on May 1, 2017
- Mongi's ELog update: DVCS ELOG LOGIN REQUIRED on May 21, 2017
- Logbook (ELOG) entry for 13418: JLAB CREDENTIALS REQUIRED
Analysis progress 2017-2018
- 8/9/2017 - 7/3/2018: Studying the effects of beam current variation on the DAQ deadtime. For more details of my progress and reports on the deadtime analysis go here.
- 8/9/2017: Issue of current dependence arises for DVCS rates normalized by current and livetime in dedicated deadtime run, e.g. 13418 at 10 uA, 15 uA, 20 uA.
- 7/3/2018: Current dependence issue is solved for run 13418 after accidental subtraction, and method for resolving current dependence has been checked for reproducibility for runs 12901 (10 uA) and 12985 (15 uA).
- Final report on deadtime studies: deadtime studies 7/3/2018
- 7/3/2018: Beginning pi0 electroproduction cross section studies for kin 48.
- 11/15/2018: Uploaded pi0 simulation based off Mongi and Bill- check it out here! and Same instructions as Bill to download on farm apply.
Updates and Progress for pi0 electroproduction studies
- 11/21/2018 - DVCS-3 Weekly meeting: Update on progress. Sent via email as ELog wasn't working; uploaded to Elog 11/26; ELog entry 549
- Notes: Background subtraction looks good - move on to smearing of photon energy to data. Have all additional info regarding smearing scripts needed from Maxime Defurne.
- 10/10/2018 - DVCS-3 Weekly meeting: Report on progress. ELog entry 540
- Notes: Julie and Frederic mentioned a factor of 2 in accidental subtraction; Carlos mentioned to look at another kinematic to compare, kin 48_1 as it is at a lower beam energy.
- 8/24/2018 - Changed ana script for ttree, and now checking to see if correct (missing mass squared looks weird).
- 8/18/2018 - discussion with Mongi about different variables and pi0 production (Geant4 simulation).
- 8/2/2018 - Tested Geant4 simulation with graphics on NPS ..can't get GEant4 sim to work again using Bill's method for some reason.
- 8/2/2018 - Discussed with Carlos about ana script..changing into ttree
- 7/14/2018 - Mongi helped with understanding pi0 analysis: gave me scripts for pi0 simulation, Bill's were only optimized for DVCS
- Need to find out how to "turn on" graphical output for GEant4 simulation to get the experimental setup. Probably best to ask Bill.
- Mongi also provided Maxime's scripts for smearing for pi0, called fit_pi0_res.C and fit_pi0_res.h
- Explained how to get missing mass squared, and why we need to "rotate" it to get rid of the correlation between the invariant mass (m) and missing mass squared (mm2). Can do it 2 ways - Mongi did it by actual rotation, Maxime did it by doing a "graphical fit" and selecting the shape of the missing mass density and rotating it.
To-do for pi0 cross section studies (2018-2019)
- Look at DVCS GEant4 Simulation and download on farm: Bill's Simulation Instructions
- Gather all root files for kin 48..Start with kin48_4, run ranges 13100 to 13162, 13279 to 13418. Alex said to put in /volatile/ or /cache/
- Try to produce waveform files for all runs and put in volatile/waveformana
- Do clustering using ana_salina_1run.C
- Make plots of t1moy vs. t2moy, binning in t, t as a function of phi
References
- Munoz, Carlos. Ph.D. Deeply Virtual Compton Scattering in Hall A at Jefferson Lab. 2009.
- Roche, Munoz, et al. Measurements of the Electron-Helicity Dependent Cross Sections of Deeply Virtual Compton Scattering with CEBAF at 12 GeV. arXiv:nucl-ex/0609015. 2014.
- Defurne, Maxime. Ph.D. Photon and pi0 electroproduction at Jefferson Lab - Hall A. 2015.
- Camsonne, Alexandre. PhD. Experimental Setup for DVCS experiment in Hall A at Jefferson Lab - Hall A. 2005.
- V. Breton. "A Clustering Algorithm for the LHCb electromagnetic calorimeter using Cellular Automaton." external link to webpage. 2001.
- Isreal, Norman. MS. Commissioning of the Trigger module for the 12 GeV era experiment E12-06-114 at JLab. 2014.
- Horn, Hyde, Munoz, Roche et al. PAC Proposal. Exclusive Deeply Virtual Compton and Neutral Pion Cross-Section Measurements in Hall C. 2013.
Acknowledgements
Thank you to Dr. Horn, Dr. Roche, Dr. Munoz, Marco Carmignotto, Mongi Dlamini for working with me, and guiding me through this project.
