MainPage:Nuclear:KaonDetector:Calculations:ExpectedSignals
| This page is under construction. |
| ⇐ Back to the Kaon Detector page |
Expected signal from the Kaon Aerogel Detector
A first estimative of the signal expected from the Kaon Aerogel Cerenkov Detector was performed based on papers about similar detectors already constructed in the past. For the calculation presented in this section, the following paper was the main basis:
- I. Adachi et al., Study of a Threshold Cherenkov Counter Based on Silica Aerogels with Low Refractive Indeces
In this paper, a formula for the estimation of the expected number of photoelectrons (npe) detected by the PMTs of the detector is given by
npe = C * (1 - (1/n^2)*(1+m^2/p^2)),
where n is the refractive index of the aerogel, m is the mass of the particle passing through the detector, p is the momentum of this particle and C is a constant related to parameters of the detector (geometry, light collection efficiency, PMT quantum efficiency, ...).
As this is a first estimative, we kept the parameter C as given by the paper. The constants used in this calculations are:
- C = 311.10
- m_Pion = 139.570 MeV/c2
- m_Kaon = 493.667 MeV/c2
- m_Proton = 938.272 MeV/c2
IMPORTANT: there is a scale factor then to the actual npe expected in the Kaon Aerogel Detector, once we did not calculated/estimated this constant for our detector yet. This calculation was performed over the refractive indeces of the trays we are constructing for the detector, as shown in the following figures.
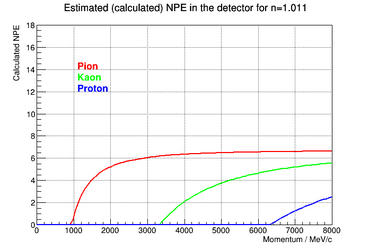
|
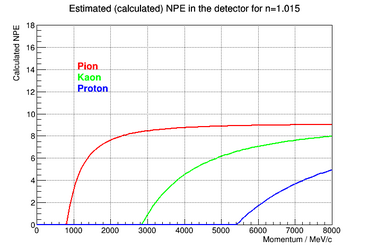
|
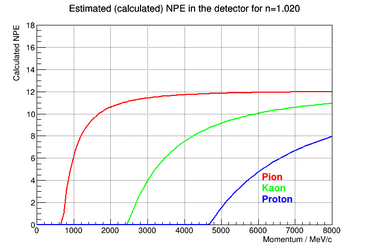
|
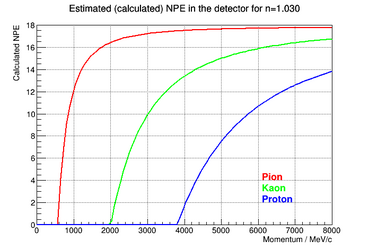
|
Momentum range for each tray
The main purpose of the Kaon Aerogel Detector is to distinguish between Kaons and Protons in the PID system of the SHMS.
In order to evaluate which tray should be used for the experiments (according to their momentum range requirements), we need to analyse what is the best momentum range for each refractive index.
Method 1
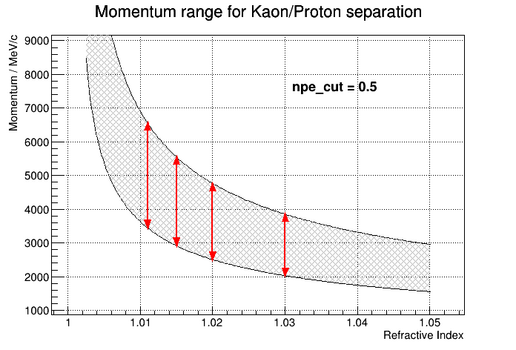
Using the curves shown in the previous section, one can determine the optimum momentum range of each tray by selecting a threshold of detection. Assuming that only signals higher than 0.5 photoelectron will be detected, one can see in those plots what is the range in momentum where there is signal (higher than 0.5 pe) only for Kaons and not Protons. The point where the momentum of a proton gives signal greater than this threshold is the upper limit of the range, while the point where the momentum of a Kaon gives a signal lower than this threshold is the lower limit of this range.
As the calculation was done based on a simple equation, it was possible to invert that equation and create a band of momentum in function of the refractive index of the aerogel. This way, one can evaluate a possible improvement of the detector in the future.
|