MainPage:Nuclear:Summer2013:AerogelCharacterization
| ⇐ Back to Summer 2013 |
| ⇐ Back to the Main_Page |
Project Overview
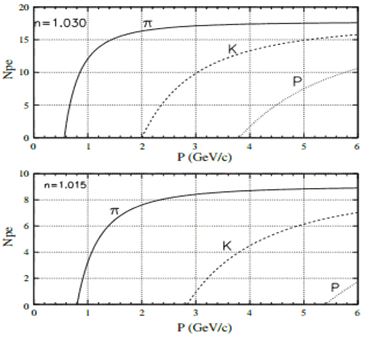
At Jefferson Lab, there is an electron accelerator which connects to each of the different halls. In Hall C, the electron collides with a proton. The proton, due to the velocity at which the electron is coming, either flies off as a whole or breaks into smaller particles, often including kaons, and the different parts fly off. In order to distinguish which of the two happened, the particles go through a series of detectors including the Kaon Aerogel Detector which distinguished protons from kaons. A picture of a detector can be seen below in Figure 1. Within the Kaon Aerogel Detector the momentum of the kaons must be greater than the aerogel’s threshold so that it will create Cerenkov radiation and the momentum of the proton must be less than the aerogel’s threshold so that it will not create Cerenkov radiation. Because only the kaons will create Cerenkov radiation the protons and kaon can be distinguished. The threshold changes depending on the refractive index of the aerogel. To calculate at what range the above situation will be true the threshold must first be identified. Then, using that velocity and the mass of the particles it can be calculated at what momentum each will create Cerenkov radiation. The momentum of the incoming particle must be between that range. In order to ensure that particles with the correct momenta are going through the detector they are first sent through a magnetic field. Depending on their velocity they will travel different distances through the magnetic field and therefore will separate out into their different velocities. Detectors are positioned at the different distance. The information generated from the detector positioned for desired velocity is then analyzed. The particle that travels through the aerogel will then either create Cerenkov radiation as it goes through or it will not. If there is Cerenkov radiation it was a kaon, if there is not it was a proton. The momentum range for SP-30’s is (3.8009, 2.001), for SP-20’s is (4.667, 2.458), and for SP-15’s is (5.395, 2.841) GeV/c. Because the range for the momentum is small, it is important to have a uniform refractive index within the detector.
The chart below is from The Aerogel Threshold Cherenkov Detector for the High Momentum Spectrometer in Hall C at Jefferson Lab by R. Asaturyan et al and shows the different momentum ranges that can be used for different refractive indices.
Brief description of goals
1. Identify the refractive index (n) experimentally in order to know what particles can best be detected when shot through it.
2. Test the effect of humidity on aerogel by putting it in an area of controlled humidity and then retesting for the refractive index.
Refractive Index
Using Snell's Law on the two faces of the aerogel where the light changes mediums, properties of triangles and properties of angles (which can be seen in the sketch below) we were able to find the derivation for n. (Note: Joel stepped us through this process)
Derivation of n: Media:nderivation.pdf
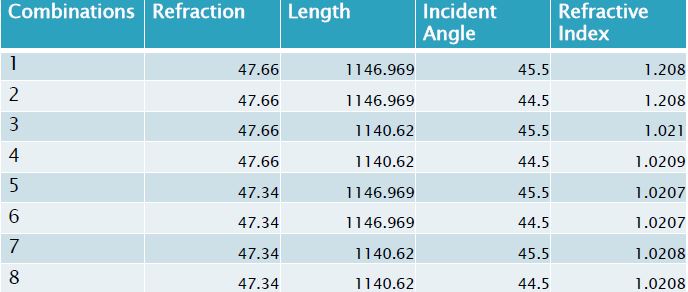
Notes for Derivation: β is assumed to be 90 degrees and α is assumed to be 45 degrees because that is how the laser has been positioned. γ is the angle between the original, unrefracted beam and the refracted beam. It is assumed that γ can be found using the arctangent of the distance between the refracted and unrefracted beam (x) and the length between β and where the beam hits the wall (L). This, though, is slightly wrong unless the incidence angle is the minimum deviation angle. Only at the minimum deviation angle is γ directly under β. Due to the fact that finding γ includes measuring from β to the wall if the γ is not directly under β, the calculations will be slightly off.
The refractive index can be found in the set up shown to the right. The aerogel is placed horizontally on a raised platform with one of its corners in the path of the laser which is 40 cm away. The laser is then turned on and passes through the aerogel. The light of both the original unobstructed beam and the refracted beam appear on the wall 108 cm away. The distance between the unobstructed laser and the refracted laser is then measure and put into a derivation to solve for n.
Aerogel SP-30 has a refractive index that ranges from 1.029 to 1.034. The SP-30 tiles' refractions are much more dispersed. There were a few outliers (one of which can be seen in the bottom figure on the right) that were removed from the data. The first outlier was slanted while the other outlier was very cloudy, but could not be seen in a picture. They were retested, but still remained the same. Both the histogram (Figure 1) and the scatter plot (Figure 2) of the data can be seen below.
Aerogel SP-20 has a refractive index between 1.018 and 1.023. The mean is 1.02 and the standard deviation is .0009. The scatter plot and histogram can be seen in Figures 3 and 4 below.
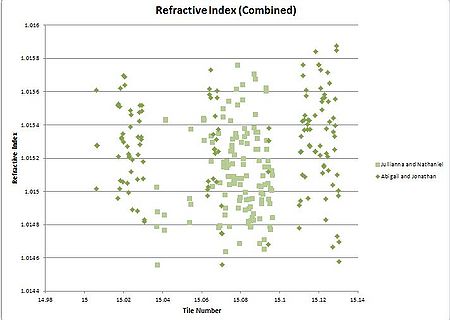
Aerogel SP-15 has a refractive index that ranges from 1.0146 to 1.0158 with a few outliers beyond that. (These outliers have been retested and have remained the same.) This can be seen in the scatter plot in Figure 5. When the refractive indices of the SP-15 tiles are put into a histogram they are centered around the mean 1.0152 and have a standard deviation of .00028. This can be seen in the histogram in Figure 6.
Uncertainty
To calculate uncertainty, we measured the distance between the refracted and unrefracted beam through one tile ten times in a row and found that the measurements had a uncertainty (standard deviation) of .161 mm. We were given that the uncertainty for the distance between the aerogel and the measuring wall was 3.175 mm. Although the incident angle was set, we were informed by Marco that the uncertainty was +/- 0.2 degrees. Marco also found through picture analysis that the uncertainty for the beta, the corner of the aerogel was +/-0.7 degrees. Using Mathematica we used this information to do and error propagation. We then applied the error to each of the points and calculated how many tiles would change bins in our histogram. These numbers became our uncertainties per bin.
Uncertainties:
SP-30: +/- .00016 SP-20: +/- .00012 SP-15: +/- .000098
Incident Angles
The angle the laser hits the aerogel effects how much the light will refract. Around 45 degrees (+/- 2 degrees) the incident angle is said to be approximately the minimum deviation angle (the angle at which light is deflected the least). With Joel's help we derived the relationship between the incident angle and the refraction distance assuming that the incident angle is the minimum deviation angle. The derivation is below:
Media:Indicent Angle Derivation.pdf
We then repeated the derivation under the condition that the laser beam goes directly through the tile entering from one side and exiting from the opposite end. Joel stepped us through the derivation and it can be seen below.
Media:Straight Through Refractive Index.pdf
We then experimented with the scenario, putting the laser directly through the middle of the aerogel and found that the refraction of the beam is almost unnoticeable small. This is because the unrefracted beam is parallel to the refracted beam and as L changes the distance between them remains the same. When the laser exits from an adjacent side, though, the beams are not parallel and an increase in L (the distance from the gel to the wall) creates an increase in x (the distance between the beams when they hit the wall) making it more measurable.
Aerogel Thickness
The thickness of the SP-15 tiles is between 10 and 11 mm. The tiles have to be measured in order to correctly set the wires that will hold them in the detector at Jefferson lab. We used two different methods to test the thickness of the aerogel. First, we put the aerogel between two pieces of metal that were exactly 3 mm thick (Figure 7). Then, after putting the aerogel tile in-between the metal plates, we tested the thickness again (Figure 8). The aerogel's thickness was then the overall thickness minus the thickness of the metal. This way, though, was somewhat subjective depending on how hard we pushed on the caliper when measuring the tiles. Therefore, we changed our method. Instead of measuring the outside of the metal we measured the inside. This method slightly reduced the subjectivity. The data fit with a Gaussian curve can be seen in Figure 9. The data is centered around the mean 10.43 and has a standard deviation of 0.24.
Jullianna tested the thickness of the SP-30 tiles before. To verify her data we tested two more tiles and they fell within her range of data (Figure 9). The two points are represented by arrows in the graph to the right. The combined graph of data fit with a Gaussian curve can be seen in Figure 10. The data is centered around the mean 11.36 and the standard deviation is .33.
Uncertainty
We believe that the systematic uncertainty in the measurements for the thickness is .01 mm. We applied this uncertainty to all of the individual points. We then calculated how many tiles each thickness bin would gain or lose if the uncertainty was added to each point. This can be seen in Figure 9. For Jullianna's data we did not add error bars because we did not have her original data but only the general points from Figure 9 that we added to in order to make Figure 10. We therefore were not able to calculate the uncertainty for her graph.
Humidity effects over Aerogel Tiles
We know from papers that aerogel is manufactured by drying silica gel and is very porous. So, in principle, the tiles can absorb water again and change their densities. As their densities are directly related to their refractive indexes, it is important to understand any change we may find.
To test the effect of humidity on aerogel we constructed a humidity controlled environment and tested individual tiles for 24 hour periods at two different humidity levels.
Materials we bought for the project:
- Humidifier - Honeywell HCM-630 Quietcare™ Cool Moisture Humidifier
- Humidifier controller - General Tools Digital Temperature and Humidity Monitor
- Humidity Gauges - Extech 445815 Humidity Meter and GSI Quality Handheld Pen-Shaped Hygro Thermometer
- Plastic box to create the controlled environment (18x22x23 cm) - Snapware 40-cup
- Water-resistant clear polyurethane tubing, 1/2" inner diameter, 5/8" outer diameter, 1/16" wall thickness
Design of Humidifier:
Starting with a Honeywell HCM-630 Quietcare™ CoolMoisture Humidifier we attached a funnel to the output area of the humidifier using electrical tape. We then attached the clear tubing to the end of the funnel by fitting the funnel inside of the tubing and then securing it with electrical tape. In order to attach the tubing to the Snapware we drilled a 5/8” hole through one of the sides of the Snapeware and inserted the tubing securing it with electrical tape.(Electrical tape was used for its water proof qualities) Finally, to avoid a buildup of pressure within the humidity controlled box we drilled 18 small holes into the lid of the Snapware container.
Calibrating and Testing the Hygrometers:
To test the accuracy of the hygrometer we used a table spoon of salt, a few drops of water, and an air tight plastic bag. We combined the salt and water in a bottle cap to make a salt slush (we did not want it to be dissolved). We then put the bottle cap into the bag, added the hygrometers, and sealed the bag. The hygrometer would ideally read 75% relative humidity (RH) because "[s]alt does not absorb moisture until the humidity reaches 75 percent. Any absorbed moisture will evaporate when the humidity falls below 75 percent."(http://www.saltinstitute.org/Uses-benefits/Winter-road-safety/Salt-storage) Therefore, the salt will continue to release water until the RH reaches 75%.
Within our specific test we found that the GSI Quality Handheld Pen-Shaped Hygro Thermometer read 72% RH.
We then tested both humidity gauges with a damp paper towel wrapped around their sensor. The reading was supposed to be between 90 and 100% RH. For the GSI Quality Handheld Pen-Shaped Hygro Thermometer the reading was 95% RH and for the Extech 445815 Humidity Meter the reading was 99% RH. We believe that the difference here was that the paper towel on the Extech 445815 Humidity Meter was moister than the one on the GSI Quality Handheld Pen-Shaped Hygro Thermometer and therefore received a higher reading.
When left in the lab both read 53% after 3 hours and when left in the humidifier on high for an hour the GSI Quality Handheld Pen-Shaped Hygro Thermometer read 78% RH and the Extech 445815 Humidity Meter read 80% RH.
Testing the Humidifier
We found that the humidifier produces a humidity of about 80% throughout the entire box. By placing the humidity detectors in different corners and under the tube, we found that the humidity did not change based on location in the box.
Testing the Tiles
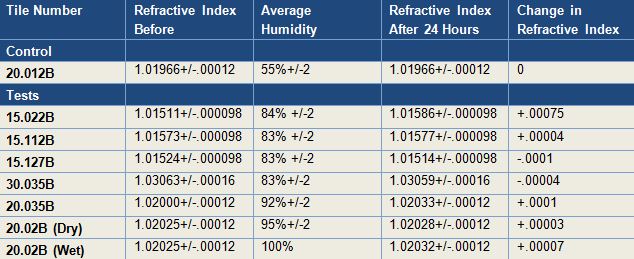
To test the effect of humidity on aerogel we ran 24 hour tests on tiles of aerogel within the humidifier. The highest setting for the humidifier was approximately 84%, so our first five tests were run at this level of humidity. In order to raise the level of humidity for the following tests we added 100 to 150 ml of water to the bottom of the container for the aerogel and then put the aerogel on top of a stand. This raised the humidity to between 90% and 94% relative humidity. The last two tests were run with the 90% humidity. Overall we found that humidity, and even direct contact with water has little to no effect on the aerogel from Matsushita Electric Works, Ltd and Japan Fine Ceramic Center. A chart of our current results can be seen below.
As a final test, we put drops of water directly onto the tiles from Matsushita Electric Works, Ltd, Japan Fine Ceramic Center, and Novosibirsk. During our research we found that when a drop of water is put onto a hydrophilic material it forms a semi-circle, but when it is put onto a hydrophobic surface is forms more of a rounded shape. On http://www.hk-phy.org/atomic_world/lotus/lotus02_e.html they illustrated this well with Figure 12. In Figure 12 on the left is a hydrophilic surface and on the right is a hydrophobic surface. Mathematically speaking, on a hydrophilic surface the contact angle between the water and the surface should be less than 90 degrees and on a hydrophobic surface there should be a contact angle greater than 90 degrees. The tiles from Matsushita Electric Works, Ltd and Japan Fine Ceramic Center were both hydrophobic. This can be seen in the pictures below. However, when we put a drop of water on the tile from Novosibirsk, it collapsed, as seen in the pictures below. The water pushed the air out of the normally porous aerogel and causes it to implode.
Transmittance
The transmittance of a tile is how much light of different wavelengths can travel through the tile. It is important for tiles with the same nominal refractive index to have tightly clustered or uniform transmittance so that the Cerenkov radiation readings will be uniform during testing. Using a PerkinElmer Lambda 750 UV/VIS/NIR spectrometer, we tested the transmittance of SP-30 and SP-20 aerogel tiles between 200nm and 900nm wave lengths. In the first test, two tiles were tested from each group, one with a normal refractive index and one with a high refractive index. The SP-30 tiles were particularly scratched, but all four tiles had similar amounts of dust on them. Due to the fact that the SP-30 tiles are denser than the SP-20 tiles, we believed that they would have a higher refractive index. Between the SP-30's and SP-20's, the SP-30's had higher transmittance; between the tiles of the same refractive index, transmittance was tightly clustered.
We then ran a second test with two more tiles from each group and got the same results.
We also ran a transmittance test on the Novosibirsk. It looked different than the others, but we think that is because we tested it in a different positions, it was only a partial piece, there were large cracks in the piece and it was thicker than the other aerogel tiles. All of these factors effected the results of the transmittance test.
Finally, we measured one tile four times through the same spot to determine the consistency of the spectrometer. By comparing the values at each wavelength, we found that the standard deviation for the machine's measurements was .24 nm. The comparative data of the transmittance test can be seen in Figures 12 through 15. More graphs and analysis of the aerogel's transmittance can be seen here:Media:Aerogel's Transmittance.pdf
Heat Testing
Using a Variac Autotransformer, a wooden box, a heater and the Extech 445815 Humidity Meter (picture can be seen in Figure 16 below) we tested the effect of heat on aerogel. Using the Variac Autotransformer to control the amount of voltage that reached the heater we controlled the heat within the box. We then tested two tiles at once for different lengths of time to see what would happen to the refractive index. The results were very uniform, though not significantly, the refractive index of all the tiles did decrease. The average decrease was -0.0019. The results can be sen in Figure 17 below (temperature is in Fahrenheit).


