MainPage:Nuclear:Summer2013:RadiationEffectsPlants
| ⇐ Back to Summer 2013 |
| ⇐ Back to the Main_Page |
General
Abstract
Radiation affects human life in disparately subtle and dramatic ways. For instance, nuclear reactions in the Sun produce light and heat that are essential for human existence, while recent research implies that the flux of cosmic ray particles may also have an impact on humans’ daily lives. The average American receives 310 millirems of radiation per year, well under a total dose of 50,000 mrems and higher doses that cause symptoms ranging from nausea to death. However, scientists hypothesize that exposure to low dosages of ionizing radiation (< 1000 millirems) may produce beneficial effects in organisms. Thus the effect of low dosages of alpha, beta, and gamma radiation (12 dosages ranging from .039 mrems of alpha radiation to 16.8 mrems of gamma radiation) on Phaseolus vulgaris was tested. The same radiation was also tested on the performance of aerogel, a material used in particle detectors. Aerogel will be used in experiments at the 12 GeV Jefferson Laboratory and has been previously observed to change its optical characteristics after being used in experiments. To determine the level of cosmic ray flux and possible contribution to our experiments a detector was created using scintillator material and 2-inch phototubes. Results from our experiments will be presented.
A copy of this abstract can be found here: Media:Abstract.pdf
Cosmic Ray Detector
The purpose of this detector is to establish the best scintillator size and number to determine an uncertainty of the fluctuation of cosmic radiation which contributes to the uncertainty of the overall radiation effecting the plants being tested. It also provides a method to check the dosage of the varying types of radiation from the following radioisotopes.
This website provides in-depth directions on how to construct a cosmic ray detector, and it's instructions provide us with a backbone from which we can design our own detector [1]
We still need to redo the flux calculations based on the method that Nathaniel used.
Preliminary Test Results
Running the muon counter for a cycle of 24 hours (1440 minutes) a total of 1948 counts were recorded. At different times during Wednesday, July 7th, the count number was recorded in order to monitor for any jumps in the data. Depicted here are graphs showing the data collected.
A second test was run with the computer counting coincidences in addition to the counting module. After 24 hours the two counters were the same, however after the weekend, the counters were off by a factor of about 2,500 counts. The computer was the lower of the counts. After 94 hours, the percent difference of the computer to the count per minute of Nathaniel's test from last semester is 16%. The recent test had 1.26 count per minute on the computer compared to 1.5 count per minute of Nathaniel's test. The module had 1.66 counts per minute and a 11% deviation from Nathaniel's tests.
At 1:40, on July 16th, a new count began in setting A to compare the count on the computer and counter in the different settings.
Random Coincidences
Sometimes, electrons pass through the two scintillators of the detector and are incorrectly counted as muons, resulting in random coincidences. In order to decrease the amount of random coincides, we will test the cosmic ray detector with 3 and even 4 panels and compare the change in count and analyze each individual coincidence (i.e. when there is a coincidence between panels 1 and 2, 2 and 3, etc.). In order to test with more than 3 detectors, we have begun construction of a third scintillator paddle. We are making it the same size as the current detectors in order to make the calculations for trigger efficiency easier.
So far two of the four trigger efficiency tests have been completed (with the top and middle and middle and bottom paddles). More test would have been completed; however, several problems have been encountered. First, gluing the PMT to the scintillator took three tries due to uncertain measurement and not enough pressure holding the two together while they were setting. The scintillator material detached from the PMT during a run (with the top and bottom paddles). The count was 362 after about 18 hours. It was found that the gluing was more successful if the PMT and scintillator are glued vertically with a small pressure applied to the scintillaro, instead of horizontally on the table. Then, at about three o'clock on Friday, August the second, we began a trigger efficiency test with all three of the paddles. However, when we began the count, the module jumped from 0 to 3. Nothing appeared to be wrong with the set-up. We restarted the count multiple times as we changed the set-up, yet the module continued to jump. It jumped a minimum of 2 counts at a time and sometimes up to 26 counts at a time.
PMT Testing
To construct a third paddle for the trigger efficiency test, a 2 inch PMT had to be tested to ensure that it works. To do this, we used the LED test using the dark box in the lab. We used a voltage of -1490 volts, a pulse period of 10 μs, a pulse duration of 5 μs, an intensity of 10 (no units), an amplitude of ±5.0 V, a pulse width of 100 ms, and a pulse delay of 100 ms. With this test, we collected data seen in here.
Sources Available
| Source | Initial Activity | Input Date | Current Activity | Radioactive Particle Distribution |
|---|---|---|---|---|
| Bi-210 | 12 μCi | 11/3/1972 | 0 μCi | β- and a little alpha |
| Cs-137 | 2.3 μCi | 7/1/1988 | 1.3 μCi | Gamma and Beta |
| Cs-137 | 17.8 μCi | 10/15/1965 | 5.92 μCi | Gamma and Beta |
| Cs-137 | 3.86 μCi | 10/15/1965 | 1.28 μCi | Gamma and Beta |
| UO2 - Ore | (1.90 g) | Alpha | ||
| Am-241 | 0.1 μCi | 10/1965 | 0.09 μCi | Primarily emits alpha, but also gamma |
| Co-60 | unknown | Gamma and Beta | ||
| Ru-106 | 5.5 μCi | 2/2/1977 | 1.05E-10 μCi | Beta |
| Sr-90 | 0.1 μCi | 6/2003 | 0.1 μCi | Beta and infrequently gamma |
| Sr-90 | 0.1 μCi | 6/2003 | 0.1 μCi | Beta and infrequently gamma |
The Effect of Radiation on Phaseolus vulgaris
Experimental Setup
To begin our experiments, we will test the effect of different low dosages and types of radiation (beta and gamma) on bean plants. After completing this portion of the experiment, we will select the dose that stimulated plant growth the most, and use it to test the effect of radiation on plants at different stages of development. To ensure that the plants germinate naturally, and without any radiation, we will germinate them in moist paper towels placed in plastic bags. This should reduce any unexpected deaths prior to germination and quicken the germination process. The seeds that germinate will be transferred to the soil in one of five cardboard boxes (33 by 33 cm). There will be two levels of independent variable in each box, and four repeated trials (two boxes per form of radiation). Therefor, for each type of radiation, there will be four levels of independent variables (total dose). To calculate the total dose, we are utilizing an online calculator, which calculates the expected dose and then we subtracted the attenuation of the soil from that number. Our dose levels (as displayed below) are relatively low, so it is not certain that they will have major or even any effect on the plants at all.
| Distance from Source (cm) | Cesium-137 (mrem/hr) | Cesium-137 through the soil (mrem/hr) | Total Gamma Dose (mrem) | Strontium-90 (mrem/hr) | Total Beta Dose (mrem) |
|---|---|---|---|---|---|
| 5.00 | 0.670 | 0.187 | 2.01 | 2.18 | 13.0 |
| 5.59 | 0.536 | 0.130 | 1.60 | 1.78 | 5.34 |
| 8.00 | 0.262 | 0.023 | 0.861 | 0.802 | 2.41 |
| 8.94 | 0.210 | 0.016 | 0.678 | 0.634 | 1.90 |
After this experiment, we will test the dosage with the most drastic results bean plants at different stages of development. The following stages will be tested: the seeds before they are placed in paper towels, germination, sapling (one week), and nearing adult (two to three weeks), and adult (over 3 weeks). We will expose the different plants for one week and compare them to a control with no radiation exposure. However, if dosages in the previous experiment have no effect on the plant growth, the layout of the next experiment will be modified.
Journal
On Tuesday, July 9th, 120 bean seeds were wrapped in wet paper towels, placed in two plastic bags, and tapped to a window. This method, instead on placing the seeds in soil, causes them to germinate quicker: these beans seeds were supposed to germinate in six to eight day, yet most of the seeds germinated by today (two days). The 105 Stringless Blue Lake bean plants will be used to test the different forms and dosages of radiation, while the 80 Top Notch Golden Wax Bush seeds will be used to test radiation's effect at different stages of development.
On Monday, July 15th, the seeds were transplanted into soil filled pots and placed by the window. The larger pots receive 500 mL of water each day, while the smaller pots receive 50 mL of water each day. The larger pots are to test the dosages displayed in the table above, while much larger dosages will be tested with the smaller pots. All of the plants will be left without radiation for several days in order to ensure that none were injured during the transplant.
On Tuesday, July 16th, the 20 Top Notch Golden Wax Bush seeds were transplanted and 10 more seeds were placed in the wet paper towels to germinate.
On Thursday, July 18th we began exposing the plants to radiation. The larger pots were exposed for three hours daily, while the smaller pots were exposed for seventeen hours.
Over the weekend of July 27th and 28th the smaller pots were left exposed to radiation for the entire duration of the weekend. Even worse than this, we forgot to put the control group for this experiment in the room as well. So essentially, the control groups got two more days of sunlight than the pots exposed to radiation. This error made our experiment very difficult to correct. The plants left in over the weekend were all wilting and in visibly bad shape. Due to this, we decided to stop taking data on the higher dosage experiments. Instead, we decided to use these plants to test the capability of the microscopes we will be using at the end of the main experiment to look at changes in cells. In addition, we can still utilize the data we collected up to the point of leaving them out of sunlight for a weekend, it just won't be as extensive as it could have been.
| Source | Current Activity | Radioactive Particle Distribution | Radiation 1 cm from source (mrem/hr) | Radiation Through the Soil(mrem/hr) | Total Radiation(mrem/hr) |
|---|---|---|---|---|---|
| Cs-137 | 1.3 μCi | Gamma and Beta | 3.679 | 2.865 | 19.632 |
| Cs-137 | 5.92 μCi | Gamma and Beta | 16.753 | 13.047 | 89.400 |
| Cs-137 | 1.28 μCi | Gamma and Beta | 3.622 | 2.821 | 16.508 |
| Am-241 | 0.09 μCi | Alpha and Gamma | 0.013 | 0.010 | 0.069 |
| Sr-90 | 0.1 μCi | Beta | 63.575 | 0 | 190.725 |
| Sr-90 | 0.1 μCi | Beta | 63.575 | 0 | 190.725 |
Microscope Images
On Wednesday, July 31st we began using microscopes provided by Professor Ann Corsi to look at cells from the stems of the experiments. We first looked at cells from the pots exposed to high dosages of radioactivity. These are the pictures taken from the microscopes. The following images were captured.
We prepared the slides by using a razor blade to scrap cells off the length of the stems of the plants from the smaller pots (higher radiation dosages) and using water as our observation medium. We used these slides to learn how to utilize the microscope and decide what needed to be looked for when we analyze the other plants on the microscopic level. When using the compound microscopes we will look for the effect of radiation on the cell structure and DNA related properties, such as number of cells dividing.
When we analyze the plants in the larger boxes, at the end of our experiment, we will book at both stem and root cells. We will also examine the plants on a microscopic level for the stages of development experiment, which we will begin on August sixth.
Results
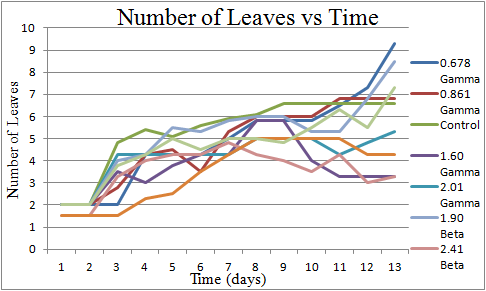
Every day we made quantitative and qualitative measurements of plant growth characteristics, e.g., diameter, height, number of leaves, color, and appearance. We graphed the effect of radiation on growth (height, diameter, and number of leaves), as well as the effect of time on the growth of the plants. All of the graphs may be seen below; however, the are not complete. *These graphs do not include the most recent data and include all outliers. At the end of the experiment, one outlier will be removed from each level of the independent variable (each dose). Also, at this moment it is uncertain if trends in data are based more on the effect of radiation on the plants or may instead be contributed to the initial differences in size of the plants.
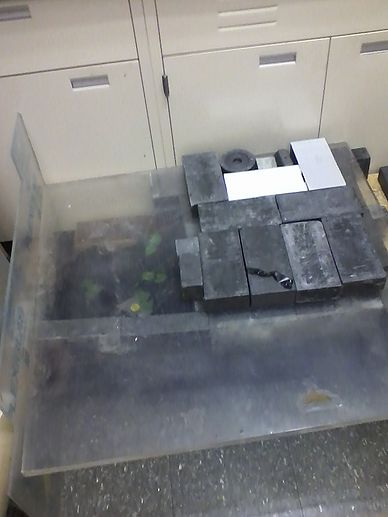
In addition, the qualitative observations made showed that some extent of etiolation (response to growing in the absence of light) occurred in the plants because of the lack of sunlight they received. The plants were not exposed to direct sunlight either from 10:00 am - 1:00 pm or from 1:00 pm to 4:00 pm. Since the sun is the strongest from 10:00 am - 4:00 pm, these time slots are less than ideal for the growth of plants as they miss they are not exposed to the sun at the most essential parts of the day. Due to this fact, many plants had yellowing leaves , and very long, thin, and pale stems, symptoms usually associated with etiolation. This hypothesis is strengthened by the fact that the boxes placed in gamma radiation, and by extension, under lead bricks, exhibited the strongest signs of an etiolative response. Therefore, the fact that the gamma boxes received less light contributed to both qualitative and quantitative variables being tested, meaning that the variable of light was not constant as would be ideal.
Changes in Plant Growth Overtime
The black diamonds represent the control, the red diamonds the gamma radiation (cesium-137), and the blue diamonds the beta radiation (strontium-90).
Height Graphs
Diameter Graphs
Number of Leaves Graphs
Stages of Growth Experiment
This experiment will test one dose of a single form of radiation on bean plants at different stages of development. Bean plants have been growing over the course of about the last four weeks in preparation for this experiment. The radiation will be applied to the plants for the first time tomorrow and they will be measured tomorrow for the first time, The experiment will last about a week, The plants will be analyzed daily as well as on the microscopic level at the completion of the project. Five different stages of development will be tested (three weeks after germination, two weeks after germination, a week after germination, right after germination, and germination).
Radiation and Aerogel
As a result of exposure to radiation, signs of yellowing have been found in aerogel tiles. Therefore, we will also explore the effect of beta and alpha radiation on aerogel.
After being exposed to Strontium-90 for approximately twenty four hours, the aerogel's color did not change. At 90 hours, there is still no discernible discoloration.
Another aerogel tile was exposed to Cesium-137 at 1:45 on July 16th, in order to compare the effect of gamma and beta radiation on the tiles.
There are still no signs of any color change, but on the 19th, a transmittance test will take place. The tiles may also just need more time to experience any sort of color change.
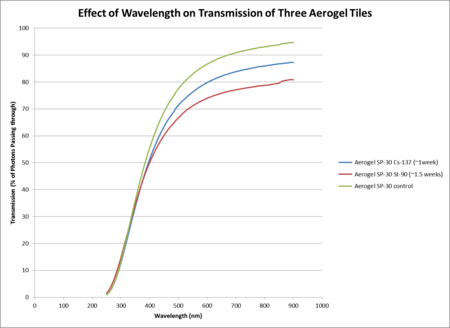
A transmission test was run on 7/19/2013 at approximately 11:30 am. Although this data suggests that the tiles exposed to radiation for longer have less transmission at higher wavelengths, this can most likely be explained by the fact that those tiles accumulated dust while in their lead shielding, causing their transmittance to go down.
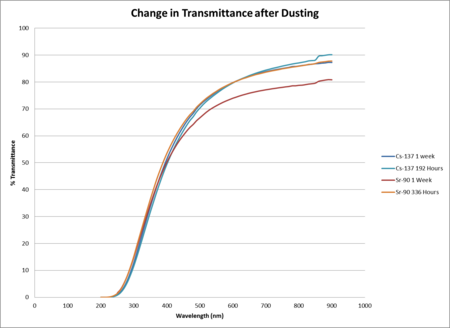
Another transmission test was conducted on Wednesday July 24th. Prior to this experiment, we used a make up brush to remove some of the dirt from the Aerogel tile. While this may have added some scratches to the tiles it greatly reduced the amount of contaminants. The scratches didn't look too significant from eyeing them. Displayed is the data recorded from this test as well as the data from 07/19 to show the increase in transmittance after cleaning them.
Another test was conducted on 07/31 to see if any change occurred in the tiles exposed to radiation. Results showed a slight change in percent transmittance for both tiles, with no significant changes occurring in the Sr-90 tile in the lower visible light range and higher UV range (~250 nm - ~400 nm). The error bars here are calculated from the four tests we have conducted on the control tile. We took the standard deviation of these four trials and used this as the uncertainty for all of our trials. The control displayed in these two graphs is the average of all four times that the control tile has been tested.
Phillips Scientific Model 417 NIM Pocket Pulsar Test
We tested the newly acquired pocket pulsar in order to ensure that we were getting a signal. The signal emmited from the pulsar is approximately -1 V and has a duration of approximately 12 ns.


