MainPage:Nuclear:Summer2014:LEDSpectrum
Abstract
Light-Emitting Diodes (LEDs) have a multitude of uses due to their increasing efficiency, long life, reliability, durability, and practical size. Consequently, LEDs are now used in robotics, diagnostic instruments, and numerous other applications including nuclear physics instrumentation. For example, since blue LEDs emit light closest to that of Cherenkov radiation, they are used to calibrate the photomultiplier tubes of the Hall C threshold aerogel Cherenkov detectors at Jefferson Laboratory. These detectors use the emission of Cherenkov radiation at different aerogel indices of refraction to distinguish pions, kaons, and protons. The wavelength-intensity properties of LEDs are also important in the characterization of aerogel optical properties, and thus the uniformity and performance of these detectors. LEDs are also practical for the PWO-based calorimeters at JLab for monitoring and recovering these crystals during and after exposure to radiation. This project is aimed at the construction and evaluation of LED-based instrumentation to characterize the optical properties of aerogel used in the JLab aerogel detectors and its application to future detectors, e.g., use of LEDs in monitoring and curing systems for PWO-based detectors. An important aspect of LEDs is that they emit light at a nominal wavelength, but their spectrum covers a broad range. It is thus important to understand the LED spectrum. As part of this project, a spectrometer was therefore constructed including a collimator to make a pointlike beam, a diffraction grating to separate the various wavelengths (or colors), and a high-speed photodiode to measure the voltage, which may then be converted into luminous intensity. In this presentation we will convey the results from measurements with LED-based instrumentation carried out to characterize the optical properties of aerogel used in the JLab Cherenkov detectors and discuss the application of LEDs covering wavelengths from the ultraviolet to near-infrared regions in future PWO-based detectors.
Contribution Statement
We constructed a photospectrometer to measure the spectrum of light-emitting diodes (LEDs) of varying target wavelengths. We placed the spectrometer in a dark box we created to limit the interference of outside light. A GW Instek GFG-8216A power supply provides 0.01 amps of current to the LED for it to generate light, which is focused into a precise beam by a collimator constructed of 4.15 cm x 0.55 cm x 0.55 cm ± 0.05 cm aluminum rod and a 7.6 cm ± 0.1 cm focal length convex lens. The Thorlabs GR50-1204 blazed diffraction grating then separates the light into its wavelengths. A Thorlabs DET-36A high-speed photodetector is moved along 4.00 mm ± 0.05 mm (the size of the detector’s lens) increments and attached to an Extech Instruments 65EA multimeter to measure the voltage of the diffracted light. To maintain consistency, the other components were placed in Styrofoam mounts we created and glued down. We calculated the wavelengths and intensities of the light at varying positions. Additionally, with some modifications to our setup we will measure the produced photon flux, allowing us to estimate the deposited power of energy and determine if the LEDs are suitable for monitoring or curing systems, given their intensity and linearity with driving current.
Light-Emitting Diodes
Background
Light-Emitting Diodes, or LEDs, were first developed by Nick Holonyak Jr. in 1962. LEDs are a type of semiconductors that convert electrical energy into light. LEDs are relatively efficient and have surpassed incandescents and will soon surpass fluorescents, due to the creation the high-power white LED. LEDs are durable and reliable. While incandescent bulbs convert only about 5% of their power into light, LEDs convert about 15 to 20% pf their power into light, making them much more efficient. Since we believe LEDs will become 10 time more efficient than incandescent bulbs, they promise to provide a source for general lighting in the near future. If LEDs are to be used on such a broad scale in the future, it is vital that more information on the optical characteristics be recorded.
The first high-brightness blue LED was demonstrated rather recently, simply in 1994, and led to the creation of the white LED. Development in the creation of LEDs causes efficiency and light output to double about every three years since the 1960s. Plus, it has led to advancements in other semiconductor technologies and optics. The popularity of LEDs is also increasing due to new methods being discovered that would reduce the production costs by tremendous amounts.
How they Work
An LED is a semiconductor with a p-n junction. Current flows from the anode or p-side of the diode to the cathode or n-side. When an electron and a hole meet, the electron travels to a lower energy level and releases a photon and thus emitting light. The color or wavelength of the light emitted varies based on the band gap energy of the material. LEDs are created of material with a direct band gap and thus the energies correspond to near-infrared, visible, or near-ultraviolet light.
Why are they important?
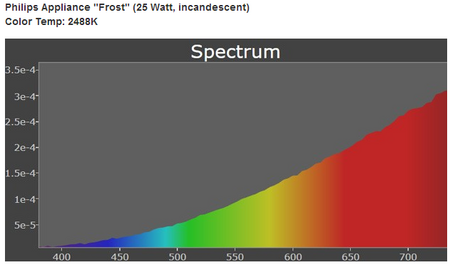
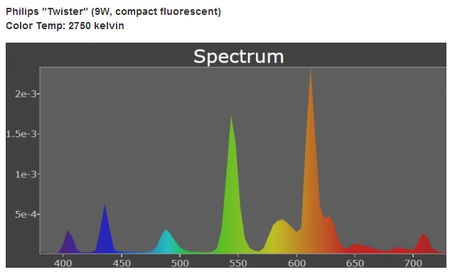
LEDs have nominal wavelengths. They generally emit simply one, precise wavelength (unlike other light sources). Below are photos showcasing the differences between the wavelengths emitted by LEDs as compared to incandescent and fluorescent bulbs.
Applications
Due to LEDs' durability, reliability, long life, and other amiable qualities their uses are broadening. The are now used in robotics, common household items, medical diagnostics, and countless other applications. The application concerning our project focused on the uniformity and performance of several detectors at Jefferson Laboratory. These applications are explained below.
Cherenkov Detectors
Since blue LEDs emit light closest to that of Cherenkov radiation, they are used to calibrate the photomultiplier tubes of the Hall C threshold aerogel Cherenkov detectors at Jefferson Laboratory. These detectors use the emission of Cherenkov radiation at different aerogel indices of refraction to distinguish pions, kaons, and protons. The wavelength-intensity properties of LEDs are also important in the characterization of aerogel optical properties, and thus the uniformity and performance of these detectors.
PWO-based Detectors
LEDs are also practical for the PWO-based calorimeters at JLab for monitoring and recovering these crystals during and after exposure to radiation. This project is aimed at the construction and evaluation of LED-based instrumentation to characterize the optical properties of aerogel used in the JLab aerogel detectors and its application to future detectors, e.g., use of LEDs in monitoring and curing systems for PWO-based detectors. Additionally, with some modifications to our setup we will measure the produced photon flux, allowing us to estimate the deposited power of energy and determine if the LEDs are suitable for monitoring or curing systems, given their intensity and linearity with driving current.
Spectrometers
Spectrometers are instruments used to measure properties of light, by separating the light into its spectral components, and then measuring light intensity or wavelength. The basic components of a spectrometer, also known as a spectrophotometer, are a light source, a collimator, a diffraction grating, a slit, and a detector. Some spectrometers have computers or other devices which analyze the data from the detector and determine radiation intensity as a function of wavelength.
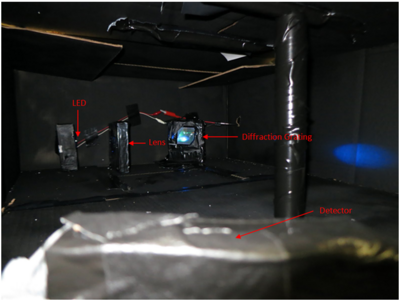
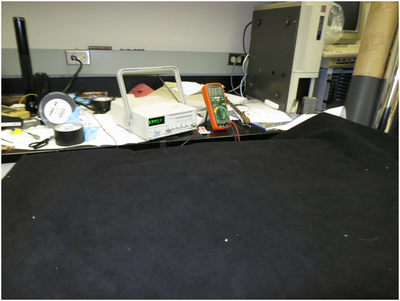
First, the light enters the collimator, which focuses and narrows the light rays by making them parallel to each other. The beam of light then hits a diffraction grating, which diffracts the light into different beams, depending on the wavelengths of the light. The slit in the spectrometer allows only one specific wavelength through to the detector. The detector determines the voltage of the wave, which is amplified with an op amp and displayed on the voltmeter. The setup of our spectrometer inside the blackbox we built (it was constructed of black spray painted cardboard boxes and covered in a thick, black curtain) may be seen to the right. The blackbox and the fact that all lights are turned off and the lab door shut while collecting data minimizes the amount of exterior light skewing the results. The specifics of our spectrometer are explained below: there is a section for each part of the spectrometer.
Collimator
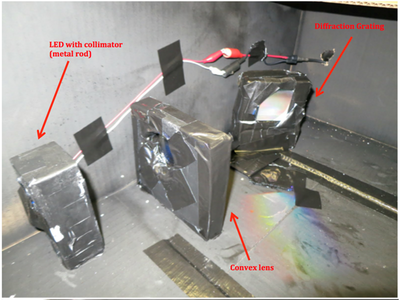
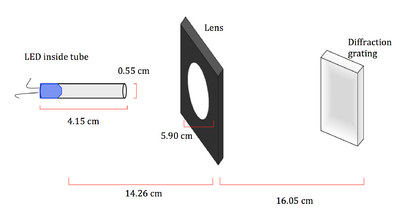
After trying several different designs (i.e. with lens, without lens, different tube lengths, etc)and testing to see which create a more intense and precise beam, we found that using a short metal tube and a convex lens resulted in the most intense and precise beam of light. The metal tube is 4.15 cm ± 0.05 cm long and has a diameter of 0.55 cm ± 0.05 cm. The convex lens with a diameter of 5.90 cm ± 0.05 cm was placed 10.75 cm ± 0.05 cm away from the end on the metal tube. The lens and collimator are held in place by Styrofoam holders we created and spray painted black/covered in black tape. They were also taped in place in the blackbox to avoid deviations in the data and keep conditions as constant as possible throughout the duration of the experiment.
Diffraction Grating
In this experiment, a blazed grating purchased from Thorlabs will be used.
The equation we will use to find the wavelength of the LED light: d(sinθ) = mλ, where θ is the angle of diffraction, m is a positive or negative integer, d is the separation of grating elements, and λ is the wavelength, or the unknown. For our specific diffraction grating, d= 1/1200 grooves per mm.
Amplifier
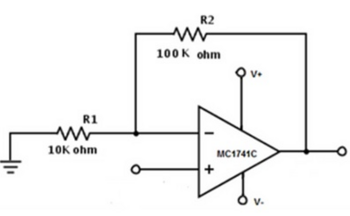
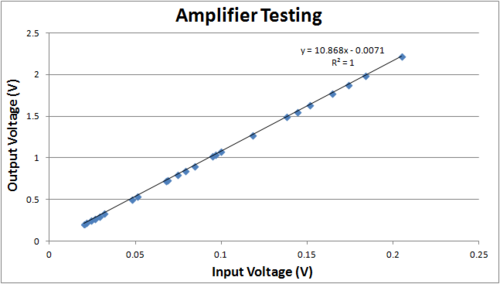
A circuit was created to amplify the voltage detected. Below are the schematics for the circuit which has a gain of 10 when an input voltage in the millivolts is provided. Resistors with values in the thousands of ohms were used because the larger resistor values resulted in less fluctuation when measuring the output voltages. The op amp used was a Motorola mc1741cp1. Fifteen volts of power were used to power the op amp and result in a working circuit. Also displayed below is a graph depicting the characteristics of the amplifier. As the resultant voltages from the LED light appear to be from about 50 - 150 millivolts, the test of the amplifier focused on the aforementioned region.
- Note: The polarity of your power supplies (two power supplies are necessary).
However the amplifier will no longer be used since the power supply has been switched from DC to AC. It was also amplified to a large enough value that it does not fluctuate a large amount with the millivolt reading on the multimeter.
Luminous Intensity
Once the detector and amplifier identify the voltage of each wavelength, we will calculate luminous intensity by first calculating the power. Then, we will convert power into luminous flux and consequently be able to find the luminous intensity.
The equations for that process are:
Φ = P × η
I = Φ / Ω
Where Φ is luminous flux (lumens), P is power (watts), η is luminous efficacy (lumens/Watt), I is luminous intensity (candelas), and Ω is solid angle (steradians)
Iv(cd) = (I(A) V(V)η(lm/W)) / Ω(sr)
Materials and Methods
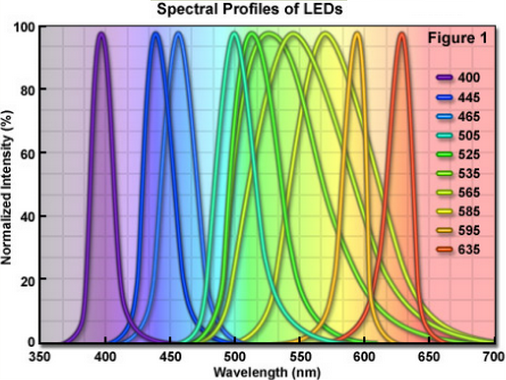
We have a number of LEDs available to test, ranging from ultraviolet to near infrared, in the lab. These are the colors present that we will test:white, ultraviolet, violet, blue, turquoise, green diffused, red, and infrared. Our final spectrum should cover a very broad range despite the individual LEDs' nominal wavelength; it should resemble the image to the right.
Convex Lens Glass, 5.90 cm diameter
Metal Rod 0.55 cm diameter
DC Power Supply (two)
Function Generator/AC Power Supply (one)
Cardboard Boxes
Black Spray Paint
Black Duck Tape
Resistors One 10 k and one 100 k resistor
Op Amp Motorola mc1741cp1 (the datasheet may be found here: http://pdf.datasheetcatalog.com/datasheet/motorola/MC1741CD.pdf)
Breadboard
Wire
Thorlabs Blazed Diffraction Grating http://www.thorlabs.com/newgrouppage9.cfm?objectgroup_id=26&pn=GR50-1204#3743
Thorlabs High-Speed Photodetectors http://www.thorlabs.com/newgrouppage9.cfm?objectgroup_id=1295
Styrofoam To create holders for LED, lens, detector, and diffraction grating
Results
Preliminary Testing
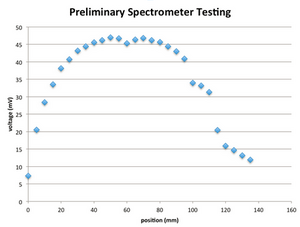
A preliminary test was conducted before the setup was completely finalized. The results may be seen to the right. Not all of the initial positions (i.e. angle) of the different parts of the spectrometer were recorded, thus the x-axis showcases position rather than wavelength. In future testing, all necessary measurements will be recorded so that the wavelength may be calculated and plotted. Additionally, the luminous intensity will be calculated and plotted against the wavelengths.
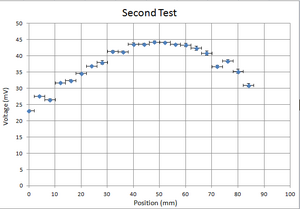
A second test took place and the results may be seen to the right. The results were similar to those of the previous preliminary test and the expected results.
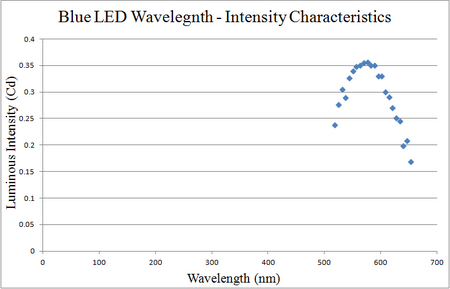
The graph to the left showcases more of the results from the second test after several calculation had been made. The wavelength of the varying section of light were calculated using the equation: λ= (d(sinθm+sinθi))/m and luminous intensity was calculated using the equation: Iv = IVη/2π(1-cos(θ/s)).
"d" is the grating line density of the diffraction grating in grooves/mm (our diffraction grating was 1,200 grooves per millimeter).
"θm" is the angle of diffraction (from the normal) in radians which may be found using trigonometry.
"θi" is the angle of incident (from the normal) in radians.
"m" is the diffraction order (which in our case was -1 for the blue LED).
"Iv" is the luminous intensity in candelas. Luminous intensity is defined as "a measure of the wavelength-weighted power emitted by a light source in a particular direction per unit solid angle" on wikipedia.
"I" is the current supplied by the power supply attached to the LED in amperes. Our power supply for test #2 was 0.078 or about 0.01 A. However we just changed the amplitude and therefore current of the power supply to 0.02 A as this is the forward current of the LED and will result in more accurate results.
"V" is the voltage measured by the detector in volts.
"η" is the luminous efficacy of the LED as provided by the manufacturer in lumens/watts. Luminous efficacy is defined as "a measure of how well a light source produces visible light" on wikipedia.
"θ" is the apex angle created by the light after it is reflected off the diffraction grating in degrees. This may be calculated using the law of cosines.
Our setup had a fair amount of uncertainty and error in it. For example, the peak wavelength of the blue LED should have been at 475 nm rather than about 575 nm. It seems as though the angle and distance measurements were off resulting in a lack of accuracy. We deducted from out results that we have a systematic error as the wavelength of the light is clearly incorrect since it is mostly blue (ranging from green to purple). Therefore, we are planning on calibrating the device with a mercury-vapor lamp of known wavelength. Also, to further eliminate error and uncertainty we would like to borrow an Arduino Uno and Unipolar Stepper Motor from the engineering department. The department has multiple of these devices on hand and they would greatly increase our precision as well as decrease the amount of time we must dedicate to collecting data. In the last two test we have been moving the detector 4 mm (along increments penciled in the inside of the dark box). Thus after every data point the dark box was opened and the detector moved by hand, which took much time, had a high amount of uncertainty, and increased the amount of outside light skewing our data as the box could not be taped shut completely.
Analysis
Conclusion
Sources
"Build a Spectrometer!" University of Colorado Boulder, n.d. Web. 3 July 2014. <http://www.colorado.edu/physics/phys3340/phys3340_sp14/CourseInformation/Optics/Build%20a%20spectrometer%20v2.pdf>.
"High Speed Photodetectors." Detectors. Thorlabs, n.d. Web. 3 July 2014. <http://www.thorlabs.com/newgrouppage9.cfm?objectgroup_id=1295>.
"Holograph Gratings, Reflective." Optical Elements. Thorlabs, n.d. Web. 3 July 2014. <http://www.thorlabs.com/NewGroupPage9.cfm?ObjectGroup_ID=25>.
"The Radiometry of Light Emitting Diodes." Labsphere. Labsphere, Inc., n.d. Web. 3 July 2014. <http://www.labsphere.com/uploads/technical-guides/The%20Radiometry%20of%20Light%20Emitting%20Diodes%20-%20LEDs.pdf>.
"Ruled Diffraction Gratings, Reflective." Optical Elements. Thorlabs, n.d. Web. 3 July 2014. <http://www.thorlabs.com/newgrouppage9.cfm?objectgroup_id=26&pn=GR50-1204#3743>.
Tavener, Stewart J., and Jane E. Thomas-Oates. "Build Your Own Spectrophotometer." Royal Society of Chemistry. N.p., Sept. 2007. Web. 3 July 2014. <http://www.rsc.org/images/EiC-05_2007-spectrophotometer_tcm18-214788.pdf>.
"Things You Should Know about LEDs." University of Nevada Los Vegas Department of Physics and Astronomy. University of Nevada Los Vegas, n.d. Web. 3 July 2014. <http://www.physics.unlv.edu/~bill/PHYS483/LED_PIN.pdf>.
Saeedifard, Maryam. "Introduction to Light Emitting Diodes (LEDs)." College of Engineering, Purdue University. Purdue University, n.d. Web. 7 July 2014. <https://engineering.purdue.edu/~ece495/Power_Electronics_Lab/LED_Basics.pdf>.
"Photometer and Optical Link." Department of Physics, University of Colorado Boulder. University of Colorado Boulder, n.d. Web. 7 July 2014. <http://www.colorado.edu/physics/phys3340/phys3340_sp07/CourseInformation/Electronics/Exp_6.pdf>.
Scalise, Randall J. "Diffraction Grading." SMU Physics Electricity and Magnetism Laboratory Manual. SMU Dedman College of Humanities and Sciences, n.d. Web. 7 July 2014. <http://www.physics.smu.edu/~scalise/emmanual/diffraction/lab.html>.
"Wavelengths of Line Spectra and the Diffraction Grating." Launceston College - Physics. Launceston College, n.d. Web. 07 July 2014. <http://www.launc.tased.edu.au/online/sciences/physics/diffra/diffrac.htm>.

