Uploads by Derek.j.boylan
Jump to navigation
Jump to search
This special page shows all uploaded files.
| Date | Name | Thumbnail | Size | Description | Versions |
|---|---|---|---|---|---|
| 14:46, 1 August 2013 | ControlClump.jpeg (file) |  |
245 KB | 1 | |
| 14:45, 1 August 2013 | 4Bbasic.jpeg (file) |  |
245 KB | 1 | |
| 14:44, 1 August 2013 | 4Abasic.jpeg (file) |  |
214 KB | 1 | |
| 14:44, 1 August 2013 | 3Abasic.jpeg (file) |  |
136 KB | 1 | |
| 14:44, 1 August 2013 | 2BBasic.jpeg (file) | 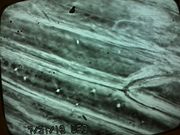 |
217 KB | 1 | |
| 14:43, 1 August 2013 | 2AUnknown2.jpeg (file) | 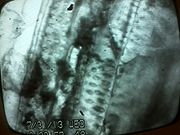 |
248 KB | 1 | |
| 14:42, 1 August 2013 | 2AUknnown1.jpeg (file) | 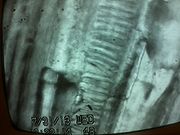 |
243 KB | 1 | |
| 14:42, 1 August 2013 | 1Cbasic.jpeg (file) | 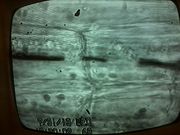 |
217 KB | 1 | |
| 14:41, 1 August 2013 | 1Bbasic.jpeg (file) |  |
241 KB | 1 | |
| 14:41, 1 August 2013 | 1Abasic.jpeg (file) |  |
213 KB | 1 | |
| 10:09, 1 August 2013 | BestSlidesEver.pdf (file) | 1.58 MB | 1 | ||
| 10:46, 25 July 2013 | CUAupdate4.pdf (file) | 234 KB | 1 | ||
| 14:05, 23 July 2013 | 2inchpmt2.bmp (file) | 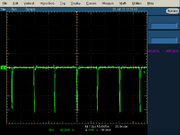 |
900 KB | 2 | |
| 14:04, 23 July 2013 | 2 inch PMT test 1.bmp (file) |  |
900 KB | 1 | |
| 14:03, 23 July 2013 | 2inchpmt1.bmp (file) | 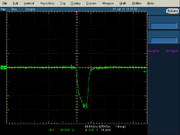 |
900 KB | 1 | |
| 13:13, 23 July 2013 | Model417PocketPulsar.bmp (file) | 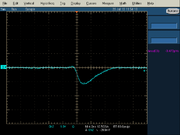 |
900 KB | 1 | |
| 15:28, 19 July 2013 | TransmissionData718.png (file) | 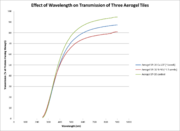 |
54 KB | 1 | |
| 14:39, 18 July 2013 | Shielding.jpg (file) | 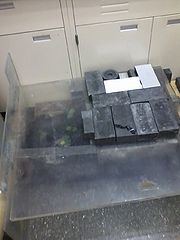 |
143 KB | 2 | |
| 13:51, 18 July 2013 | TestRunes.png (file) | 27 KB | 3 | ||
| 10:48, 18 July 2013 | Slides18.pdf (file) | 133 KB | 1 | ||
| 11:02, 12 July 2013 | 0711 RadiationPlants.pdf (file) | 190 KB | 1 | ||
| 09:58, 12 July 2013 | InitialAerogelTop.jpg (file) |  |
232 KB | 3 | |
| 09:48, 12 July 2013 | InitialAerogelSide.jpg (file) |  |
123 KB | 2 | |
| 16:13, 10 July 2013 | Example3.jpg (file) | 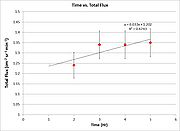 |
69 KB | Fig. 3: The total flux at each time period is displayed on the y axis. Once the flux was very high in between 19.75 and 20 hours though, it increased the total flux substantially. | 1 |
| 16:07, 10 July 2013 | Example2.jpg (file) | 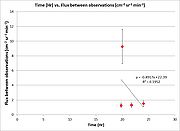 |
70 KB | Fig. 2: The flux in between observations (from one time to the next) is displayed on the y. This shows that there was a large increase in between 19.75 and 20 hours in muon count. This data should fluctuate, but not by this extent. This shows that there w | 1 |
| 16:03, 10 July 2013 | Example.jpg (file) | 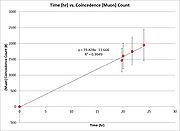 |
72 KB | Fig. 1: The total count of coincidences, which are mostly muons, is displayed on the y axis, while time in hours is displayed on the x. The line of best fit shows a pretty steady trend, with no jumps occurring, but upon closer inspection, this does not ap | 2 |
| 11:19, 10 July 2013 | Schematic.png (file) | 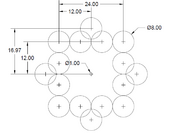 |
21 KB | Design for plant placement in soil. This will increase space between plants as well as allow for two levels of independent variable and eight repeated trials. | 1 |
| 11:59, 5 July 2013 | 0703 RadiationPlants.pdf (file) | 234 KB | 1 |