MainPage:Nuclear:Summer2013:AerogelCharacterization
| ⇐ Back to Summer 2013 |
| ⇐ Back to the Main_Page |
Brief description of goals
1. Identify the refractive index (n) experimentally in order to know what particles can best be detected when shot through it.
2. Test the affect of humidity on aerogel by putting it in an area of controlled humidity and then retesting for the refractive index.
Refractive Index
Using Snell's Law on the two faces of the aerogel where the light changes mediums and the properties of triangles and properties of angles (which can be seen in the sketch below) we are able to find the derivation for n. (Note: Joel stepped us through this process)
Derivation of n: Media:nderivation.pdf
Notes: Beta is assumed to be 90 degrees and alpha is assumed to be 45 degrees because that is how the laser has been positioned. Gamma is the angle between the original, unrefracted beam and the final refracted beam. It is assumed that gamma can be found using the arctangent of the difference between the original beam and the refracted beam and the length between beta and where the beam hits the wall. This, though, is slightly wrong (unless the incidence angle is the minimum deviation, because only then is the imaginary triangle that can be made by extending the normal lines where the light beam hits the face of the aerogel is the angle gamma actually under beta). Due to the fact that you are measuring from the wall where the light hits to gamma, if the angle is not directly under it, the calculations will be slightly off. Finally, x is the distance between the unrestricted beam and the refracted beam and L is the distance from beta to the wall.
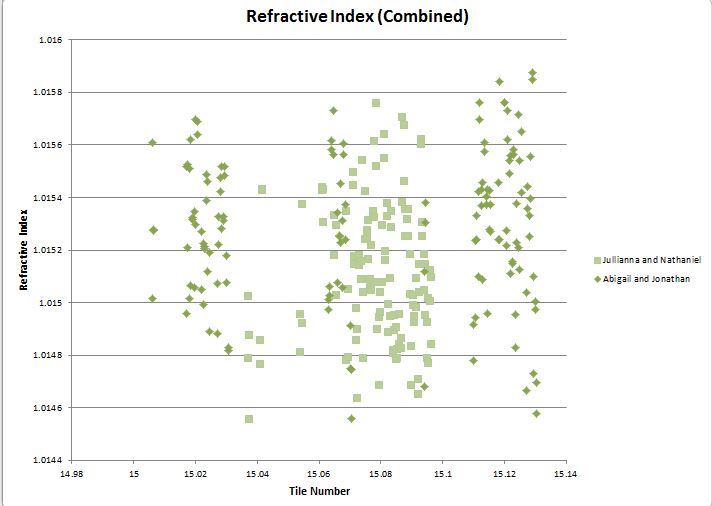
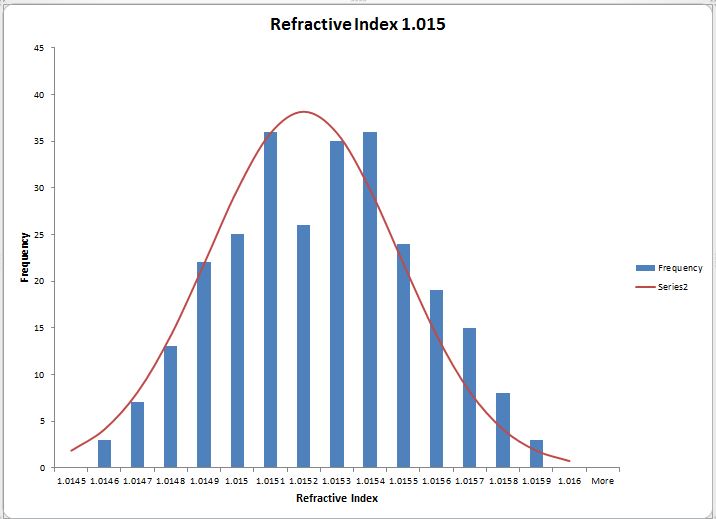
When the refractive indices of the aerogel tiles are put into a histogram they are centered around the mean 1.0152 and have a standard deviation of .00028.
Aerogel Thickness
The thickness of the SP-15 tiles are between 10 and 11 mm. The tiles have to be measured in order to correctly set the wires that will hold them in the detector at Jefferson lab. We used two different methods to test the thickness of the aerogel. First, we put the aerogel between two pieces of metal that were exactly 3 mm thick. Then, after putting the aerogel tile in-between the metal plates, we tested the thickness again. The aerogel's thickness was then the overall thickness minus the thickness of the metal. This way, though, was somewhat subjective depending on how hard we pushed on the caliper when measuring the tiles. Therefore, we changed out method while using the same set-up. Instead of measuring the outside of the metal we measured the inside. This method slightly reduced the subjectivity. The data fit with a Gaussian curve can be seen below. The data is centered around the mean 10.4283 and has a standard deviation of 0.2428.
Jullianna tested the thickness of the SP-30 tiles before. To verify her data we tested two more tiles and they fell within her range of data. The two points are represented by arrows in the graph to the right. The combined graph of data fit with a Gaussian curve can be seen below. The data is centered around the mean 11.363 and the standard deviation is .3346.
Media:Jullianna Aerogel Height.pdf
The error bars on the graphs represent out estimated uncertainty. We found a measurement subjectivity of about .15 mm, though our measurements have bigger differences with Jullianna and Nathaniel's data.
We also found online that a modified average deviation was a good way of mathematically solving for uncertainty. First, we found the deviation of each measurement from the mean. We then took the average. Then, we divided by the square root of the number of entries (82). That told us that our modified average deviation was .024mm.
Humidity effects over Aerogel Tiles
One of our concerns for the long term use of aerogel, in the Kaon Aerogel Detector, is how the aerogel will behave. We know from papers that it is manufactured by drying silica gel. So, in principle, the tiles can absorb water again and change their densities. As their densities are directly related to their refractive indexes, it is important to understand any change we may find.
The tiles we have are coated by an hydrophobic thin layer of material, so we have a protection on them already. And the trays of the detector will be rightly stored. But studying the water absorption and its effects on the aerogel properties would be an interesting way of understanding better our detector.
The first idea would be to construct an isolated box to have one aerogel tile submitted for a long time into high humidity. From time to time, we would measure the mass and refractive index of the tile to see any change on its properties.
Materials we bought for the project:
- Humidifier - Honeywell HCM-630 Quietcare™ Cool Moisture Humidifier
- Humidifier controller - General Tools Digital Temperature and Humidity Monitor
- Humidity Gauges - Extech 445815 Humidity Meter and GSI Quality Handheld Pen-Shaped Hygro Thermometer
- Plastic box to create the controlled environment (18x22x23 cm) - Snapware 40-cup
- Water-resistant clear polyurethane tubing, 1/2" inner diameter, 5/8" outer diameter, 1/16" wall thickness
Design of Humidifier:
We captured the output using a funnel and connected it to the plastic box using plastic tubing and tape. By punching small holes in the top of the box, we allow air to escape and prevent a build up of pressure within the chamber. We placed a humidity gauge within the chamber in order to monitor the percentage of humidity within the box.
Calibrating and Testing the Hygrometers:
To test the accuracy of the hygrometer we are using about a table spoon of salt, a few drops of water, and an air tight plastic bag. We begin by combining the salt and water in a bottle cap to make a salt slush (we do not want it to be dissolved). We then put the bottle cap into the bag, added the hygrometers, and sealed the bag. The hygrometer should read 75% relative humidity (RH) becuse "Salt does not absorb moisture until the humidity reaches 75 percent. Any absorbed moisture will evaporate when the humidity falls below 75 percent."(http://www.saltinstitute.org/Uses-benefits/Winter-road-safety/Salt-storage) Therefore, the salt will continue to release water until the RH reaches 75%.
Within our specific test we found that the GSI Quality Handheld Pen-Shaped Hygro Thermometer read 72% RH.
We then tested both humidity gauges with a damp paper towel wrapped around their sensor. The reading was suppose to be between 90 and 100% RH. For the GSI Quality Handheld Pen-Shaped Hygro Thermometer the reading was 95% RH and for the Extech 445815 Humidity Meter the reading was 99% RH. We believe that the difference here was that the paper towel on the Extech 445815 Humidity Meter was more moist than the one on the GSI Quality Handheld Pen-Shaped Hygro Thermometer and therefore received a higher reading.
When left in the lab both read 53% after 3 hours and when left in the humidifier on high for an hour the GSI Quality Handheld Pen-Shaped Hygro Thermometer read 78% RH and the Extech 445815 Humidity Meter read 80% RH.

