Difference between revisions of "MainPage:Nuclear:KaonDetector:AerogelCharacteristics"
| (31 intermediate revisions by the same user not shown) | |||
| Line 7: | Line 7: | ||
{|border="1" cellpadding="2" cellspacing="0" style="background-color:lightgray" | {|border="1" cellpadding="2" cellspacing="0" style="background-color:lightgray" | ||
| <font size="2">'''[[MainPage:Nuclear:KaonDetector|⇐ Back to the Kaon Detector page]]'''</font> | | <font size="2">'''[[MainPage:Nuclear:KaonDetector|⇐ Back to the Kaon Detector page]]'''</font> | ||
| + | |} | ||
| + | |||
| + | == Tiles thickness and refractive indexes == | ||
| + | |||
| + | The thickness of the tiles were measured using an indirect method. We measure the shadow created by each tile when a plane laser beam (from a construction alignment tool laser) was incident on its lateral surface. To check the precision of the method, one plastic sheet was measured either with a caliper and with the shadow method. It was found a standard deviation of 0.12 mm from one method to the other. | ||
| + | |||
| + | We avoided measuring tiles directly with a caliper or a micrometer because aerogel is a fragile material. We could break some tiles with those equipment easily. | ||
| + | |||
| + | It is important to note that some tiles have a slight variation in thickness along their area. A more specific study on the uniformity of tiles thicknesses will be done soon. | ||
| + | |||
| + | A histogram of the first measured box is shown in the following figure, with the respective refractive index distribution. The last one was measured using the method discribed in [[MainPage:Nuclear:KaonDetector:AerogelCharacteristics#Refractive_index_measurement|Refractive index measurement section]], but measuring the distance of refracted and direct beam with a caliper (typical value of 72.00 +/- 0.01mm). | ||
| + | |||
| + | {| border="0" style="text-align:center;" width="100%" | ||
| + | |+'''Aerogel Thickness''' | ||
| + | |- | ||
| + | | valign="top"| | ||
| + | [[File:1030_box01_thickness.png|thumb|center|300px|Thickness distribution of the 1.030 tiles from box01, a sample of the tiles that are going to be placed in the Kaon Aerogel Detector.]] | ||
| + | | valign="top"| | ||
| + | [[File:1030_box01_refractiveIndex.png|thumb|center|300px|Refractive index of this box01.]] | ||
| + | |} | ||
| + | |||
| + | == Optical properties - Transmittance == | ||
| + | |||
| + | In order to starting measuring the light absorption properties of aerogel, a spectrometer was used for the measurement of the transmittance of some tiles (figure 1). | ||
| + | |||
| + | '''IMPORTANT''': this method measures only the transmittance of the tiles. It cannot distinguish between scattered and absorbed light. As in the Kaon Aerogel Detector the scattered light is still considerable to be collected by one of the PMTs, it is necessary to disentangle these parts. Discussion on this disentangling is showed below. | ||
| + | |||
| + | The spectrometer consists of a monochromatic beam of light (1 nm resolution) that is chopped in two different paths: reference and beam (figure 2). One aerogel tile is placed on the beam path (figure 3), so the spectrometer measures the light intensity difference between the beam and reference path, giving the transmittance of the analyzed sample. | ||
| + | |||
| + | {| border="0" style="text-align:center;" width="100%" | ||
| + | |+'''Experimental setup for aerogel transmittance characterization''' | ||
| + | |- | ||
| + | | valign="top"| | ||
| + | [[File:Spectrometer_Perker750.jpg|thumb|center|300px|1) Equipment "Perkin/Elmer Lambda 750 Spectrometer" used for the analysis.]] | ||
| + | | valign="top"| | ||
| + | [[File:Spectrometer_beams.jpg|thumb|center|300px|2) Inside the spectrometer where the monochromatic light beam is chopped in two: reference and beam. The sample to be analyzed is placed in the beam position.]] | ||
| + | | valign="top"| | ||
| + | [[File:Spectrometer_tile.jpg|thumb|center|300px|3) Aerogel tile placed in the beam position for transmittance analysis.]] | ||
| + | |} | ||
| + | |||
| + | A sample of tiles of the different refractive indexes were analysed using this method. Results of this sample are shown in the following graphs. | ||
| + | |||
| + | {| border="0" style="text-align:center;" width="100%" | ||
| + | |+'''Transmittance of a sample of aerogel tiles''' | ||
| + | |- | ||
| + | | valign="top"| | ||
| + | [[File:transmittance_103.jpg|thumb|center|300px|Tiles with nominal refractive index 1.030.]] | ||
| + | | valign="top"| | ||
| + | [[File:transmittance_102.jpg|thumb|center|300px|Tiles with nominal refractive index 1.020.]] | ||
| + | | valign="top"| | ||
| + | [[File:transmittance_1015.jpg|thumb|center|300px|Tiles with nominal refractive index 1.015 (first lot).]] | ||
| + | |} | ||
| + | |||
| + | == Refractive index measurement == | ||
| + | |||
| + | In order to evaluate the quality of the aerogel tiles we bought for the Kaon Aerogel Detector, an experimental setup was prepared. A few sample of tiles were randomly selected and analyzed. | ||
| + | |||
| + | {| border="0" style="text-align:center;" width="100%" | ||
| + | |+'''Refractive index results''' | ||
| + | |- | ||
| + | | valign="top"| | ||
| + | [[File:Refractive_Index_103_102.jpg|thumb|center|300px|Refractive index of some randomly selected aerogel tiles with nominal index of 1.030 and 1.020.]] | ||
| + | | valign="top"| | ||
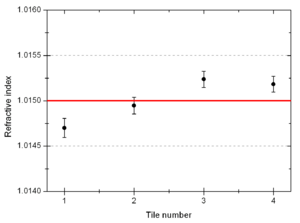
| + | [[File:tile_1to4.png|thumb|center|300px|Refractive index tiles with nominal index of 1.015.]] | ||
| + | |} | ||
| + | |||
| + | This method consists of a laser sheet, part of it passing through the analyzed aerogel tile and the other part passing out of it. The beam that goes inside the tile get refracted. A reference paper is placed after the tile to mark both the direct and refracted beams. The deviation of the laser is them possible to be measured (using image analysis) for the calculation of the refractive index that causes such deflection. | ||
| + | {| border="0" style="text-align:center;" width="100%" | ||
| + | |+'''Example of aerogel refractive index analysis''' | ||
| + | |- | ||
| + | | valign="top"| | ||
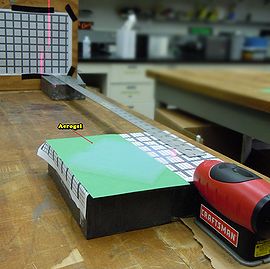
| + | [[File:refrac_index_setup.jpg|thumb|center|270px|1) Experimental setup for the measurement of the aerogel refractive index. A laser sheet is refracted by the tile and hit a target paper. The deviation of the laser can be measured for the calculation of the refractive index.]] | ||
| + | | valign="top"| | ||
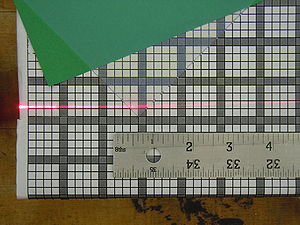
| + | [[File:4491.jpg|thumb|center|300px|2) Part of the laser sheet pass through the aerogel tile, being deflected by its refractive index. The other part pass on the top of the tile, going direct to the reference paper target.]] | ||
| + | | valign="top"| | ||
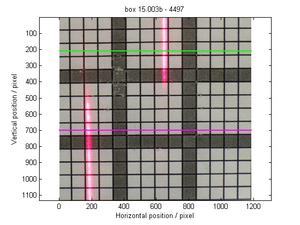
| + | [[File:refracIndex_4497_orig.png|thumb|center|300px|3) Picture of the reference paper with the direct (top) and refracted (bottom) laser beam. Two lines are selected for the pixel intensity analysis, looking for the peaks identification.]] | ||
| + | |- | ||
| + | | valign="top"| | ||
| + | [[File:refracIndex_4497_calib.png|thumb|center|300px|4) Calibration process example: a MatLAB code identifies the grid lines of the target paper.]] | ||
| + | | valign="top"| | ||
| + | [[File:refracIndex_4497_calib2.png|thumb|center|300px|5) Knowing the grid size of the previous image, the relation pixel to millimeter can be calibrated along the desired line.]] | ||
| + | | valign="top"| | ||
| + | [[File:refracIndex_4497.png|thumb|center|300px|6) After the calibration of the two lines (directed and refracted beams), the peaks position can be fitted for the analysis of the refracted beam deflection due to the aerogel.]] | ||
| + | |} | ||
| + | |||
| + | == Blast detector - source of aerogel SP30 == | ||
| + | |||
| + | We are going to take 1.03 tiles from the Blast detectors, in order to fill in our 1.03 tray with SP30 aerogel. | ||
| + | |||
| + | {| border="0" style="text-align:center;" width="100%" | ||
| + | |+'''Blast detector - from where we are taking SP30 aerogel''' | ||
| + | |- | ||
| + | | valign="top"| [[File:1030_blast_picture01.jpg|thumb|center|300px|One of the detectors from Blast experiment, being cleaned before opening it.]] | ||
| + | | valign="top"| [[File:1030_blast_picture02.jpg|thumb|center|300px|The Blast detector opened. It is possible to see the 5(?) layers of aerogel stacked on the bottom. Strips of Mylar were used on the top and also in between columns of aerogel, to hold them on postion.]] | ||
| + | | valign="top"| [[File:1030_blast_picture03.jpg|thumb|center|300px|Rigorous inspection done on the tiles!]] | ||
| + | |- | ||
| + | | [[File:1030_blast_picture04.jpg|thumb|center|300px| Edge of the detector showing the nice painting they did for light reflection on the walls. It is not clear on the pictures, but some tiles close to the walls have yellowish edges.]] | ||
| + | | [[File:1030_blast_picture05.jpg|thumb|center|300px| Mylar strips, placed on the top and also between rows of aerogel tiles, are hold from the outside of the detector. Slits were placed to make these mylar to go outside and hold with black tape.]] | ||
| + | | [[File:1030_blast_picture06.jpg|thumb|center|300px| One strip of Mylar was removed for aerogel inspection. The tiles are in very good shape, no much chipped edges and very clean. A sample of these tiles are being taken to refractive index and light transmittance tests at CUA.]] | ||
|} | |} | ||
Latest revision as of 13:38, 1 August 2013
| This page is under construction. |
| ⇐ Back to the Kaon Detector page |
Tiles thickness and refractive indexes
The thickness of the tiles were measured using an indirect method. We measure the shadow created by each tile when a plane laser beam (from a construction alignment tool laser) was incident on its lateral surface. To check the precision of the method, one plastic sheet was measured either with a caliper and with the shadow method. It was found a standard deviation of 0.12 mm from one method to the other.
We avoided measuring tiles directly with a caliper or a micrometer because aerogel is a fragile material. We could break some tiles with those equipment easily.
It is important to note that some tiles have a slight variation in thickness along their area. A more specific study on the uniformity of tiles thicknesses will be done soon.
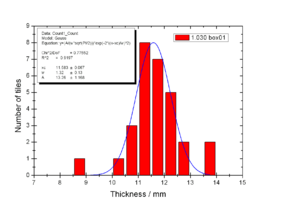
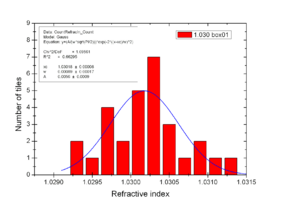
A histogram of the first measured box is shown in the following figure, with the respective refractive index distribution. The last one was measured using the method discribed in Refractive index measurement section, but measuring the distance of refracted and direct beam with a caliper (typical value of 72.00 +/- 0.01mm).
Optical properties - Transmittance
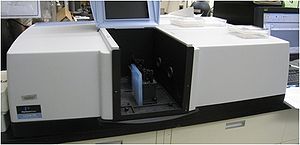
In order to starting measuring the light absorption properties of aerogel, a spectrometer was used for the measurement of the transmittance of some tiles (figure 1).
IMPORTANT: this method measures only the transmittance of the tiles. It cannot distinguish between scattered and absorbed light. As in the Kaon Aerogel Detector the scattered light is still considerable to be collected by one of the PMTs, it is necessary to disentangle these parts. Discussion on this disentangling is showed below.
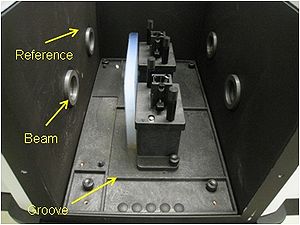
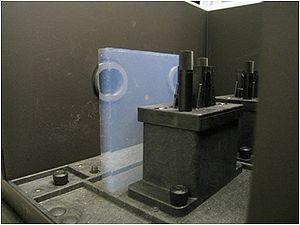
The spectrometer consists of a monochromatic beam of light (1 nm resolution) that is chopped in two different paths: reference and beam (figure 2). One aerogel tile is placed on the beam path (figure 3), so the spectrometer measures the light intensity difference between the beam and reference path, giving the transmittance of the analyzed sample.
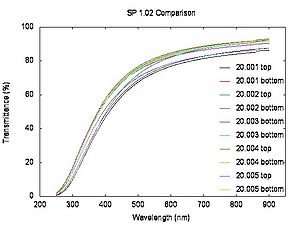
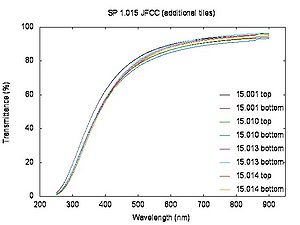
A sample of tiles of the different refractive indexes were analysed using this method. Results of this sample are shown in the following graphs.
Refractive index measurement
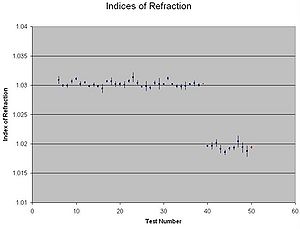
In order to evaluate the quality of the aerogel tiles we bought for the Kaon Aerogel Detector, an experimental setup was prepared. A few sample of tiles were randomly selected and analyzed.
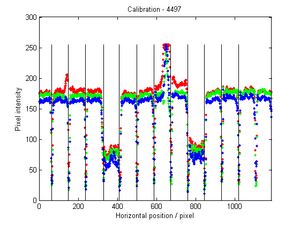
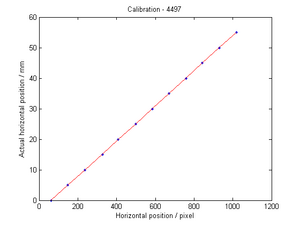
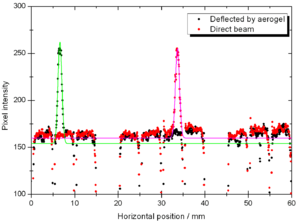
This method consists of a laser sheet, part of it passing through the analyzed aerogel tile and the other part passing out of it. The beam that goes inside the tile get refracted. A reference paper is placed after the tile to mark both the direct and refracted beams. The deviation of the laser is them possible to be measured (using image analysis) for the calculation of the refractive index that causes such deflection.
Blast detector - source of aerogel SP30
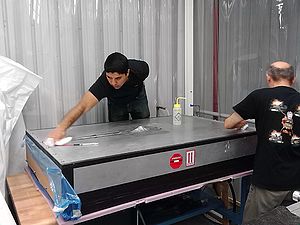
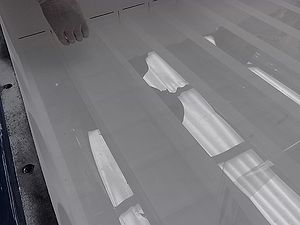
We are going to take 1.03 tiles from the Blast detectors, in order to fill in our 1.03 tray with SP30 aerogel.
Kaon Aerogel Detector prototype - Aerogel light yield comparison
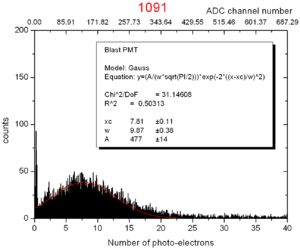
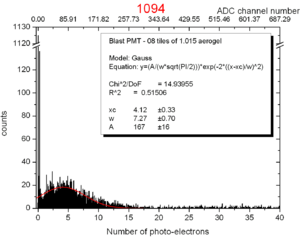
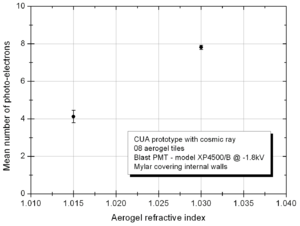
In order to compare the different aerogel (refractive index) we will use in the Kaon Aerogel Detector, a set of cosmic rays data was acquired with the CUA's prototype. Details of the prototype can be found in the Prototype page.
To evaluate the relative light yield of the aerogel tiles with refractive indexes 1.030 and 1.015, the setup was run with the same configuration twice (just exchanging the aerogel).
The setup configuration was kept as follows:
- Cosmic ray configuration (two triggering PMTs with scintillator on the top and bottom of the prototype)
- 08 aerogel tiles
- Mylar covering the internal walls of the prototype
- High voltage of -1.80 kV on the PMT
- Blast PMT for all runs (model XP4500/B s/n 09650, with calibration from run 481)
To see a similar test done for the analysis of the different PMTs options for the Kaon Aerogel Detector, click here.
